
Die folgende Kurzstudie wurde im Auftrag von Greenpeace e.V. erstellt. Sie untersucht die Übergewinne der Mineralölwirtschaft im Tankstellenmarkt in den 27 Mitgliedstaaten der EU vom 1. März bis zum 19. Oktober 2026.
Excess Oil Profits in the EU
An analysis of higher margins on the sale of diesel and petrol since the beginning of the Iran war
Commissioned by
Greenpeace e.V.
Hamburg/Germany
October 2026
Contents
- Executive Summary
- Kap.1 Oil Crisis and Excess Profits
- Kap.2 Background: The Journey of Oil
- Kap.3 Methodology and Data Source
- 3.1 Margin calculation
- 3.2 Data Sources
- Kap.4 Results
- 4.1 EU-wide excess profits
- 4.2 Excess profits in EU member states
Executive Summary
The outbreak of the Iran war on 28 February 2026 set off a dramatic surge in oil and gas prices worldwide. As in 2022, shortly after the start of the war in Ukraine, Europe’s oil refiners have emerged as the main beneficiaries of the crisis.
Since March, they have been earning exceptionally high excess profits („windfall profits“, „super profits“) in the EU’s retail fuel market for diesel and petrol. Excess profits are additional profits that are earned against the backdrop of a severe crisis and exceed normal profit levels.
This short study uses a simplified margin model to quantify the excess profits from petrol and diesel sales for the EU as a whole and for each of the 27 member states. The period under review runs from 1 March to 19 October 2026.
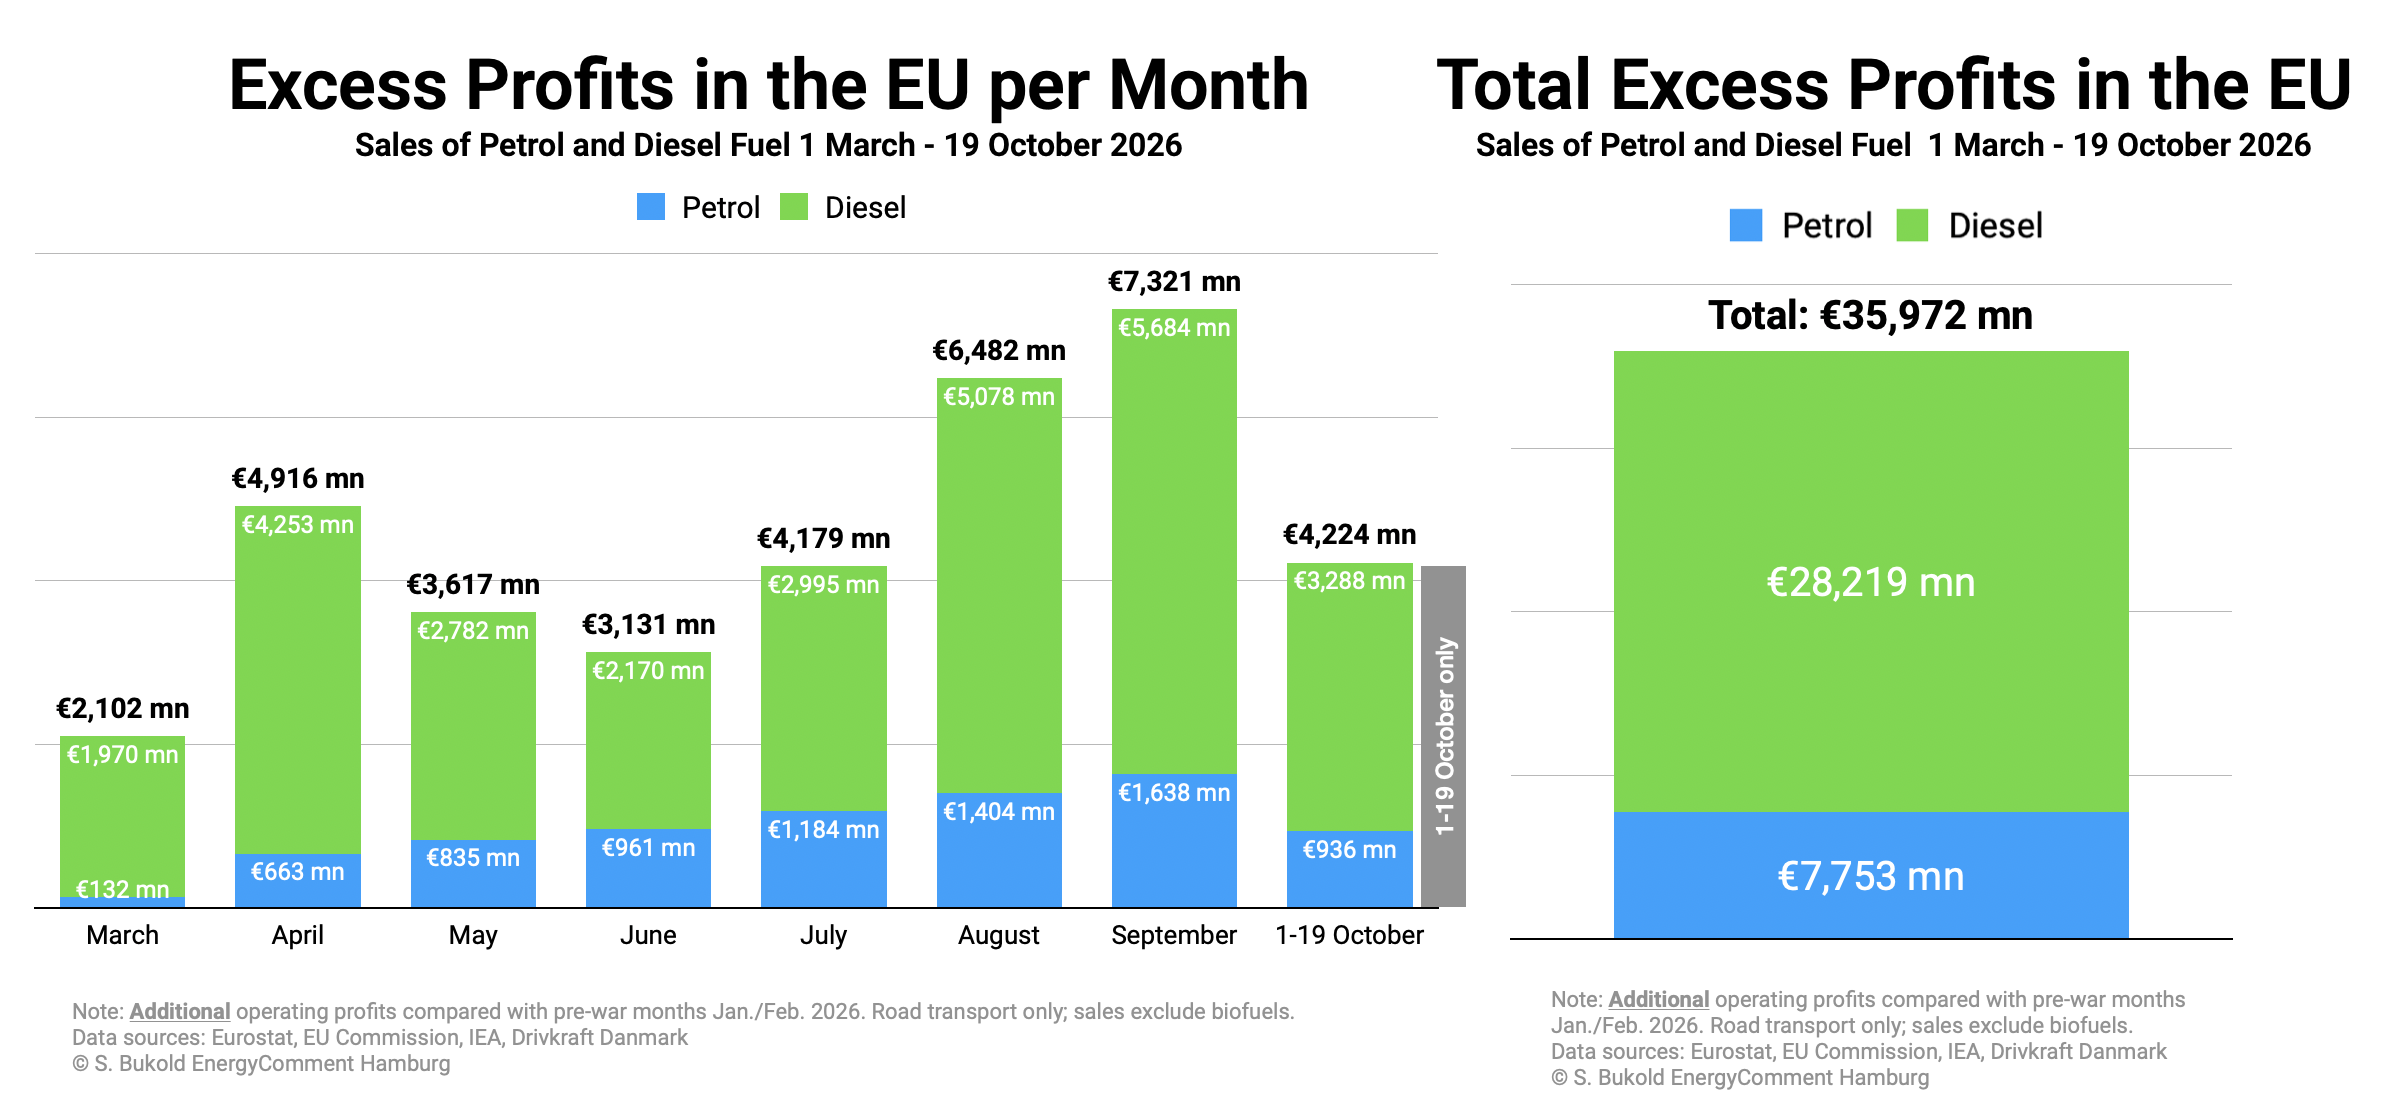
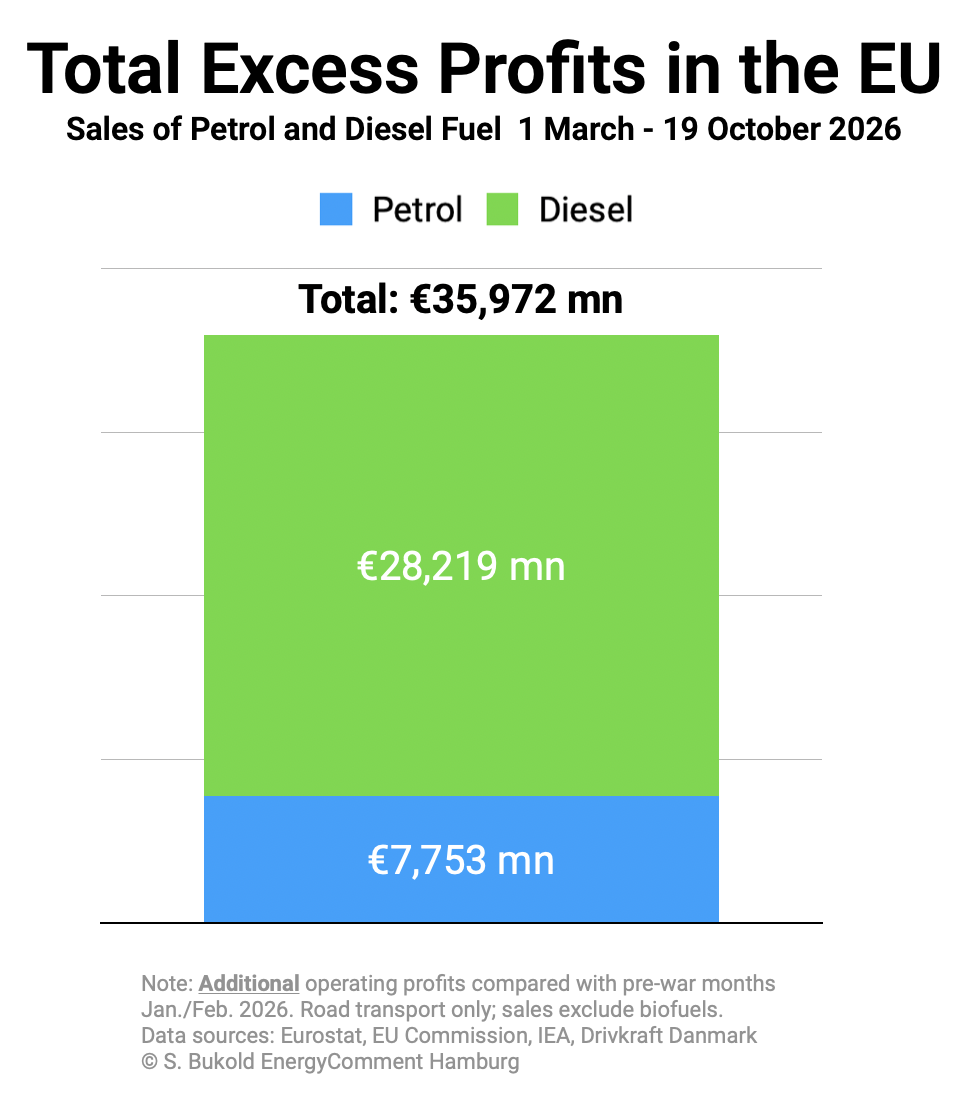
EU-wide excess profits: €36.0 billion (35972 million euros)
Diesel sales account for around €28.2bn of this total, while excess profits in the petrol market came to just under €7.8bn.
With the exception of Malta, the oil industry has increased its profits significantly, and in some cases sharply, in every EU member state compared with the pre-war months. The scale varies, but the trend is visible across Europe.
Across the EU, the oil industry generated average daily excess profits of €33.3mn in the retail petrol market and €121.1mn in the retail diesel market, a combined total of €154.4mn per day.
Among the member states, the figures range from €28.7mn a day in Germany to minus €0.1mn a day in Malta (see Chapter 4.2 for detailed country charts).
1. Oil Crisis and Excess Profits
The outbreak of the Iran war on 28 February 2026 triggered a dramatic rise in oil and gas prices around the world. Almost overnight, it became clear once again how dependent Europe’s economy and society are on imported fossil fuels.
Nearly eight months into the crisis, there is still no end in sight to the conflict in the Persian Gulf. On the contrary: in addition to the Strait of Hormuz, oil exports via the Red Sea are also at risk. Crude prices climbed back above $100 a barrel in October.
Trade in oil products such as diesel and jet fuel has also suffered for months from outages at major refineries in the Persian Gulf. On top of that, Russian diesel exports have slumped following successful Ukrainian drone strikes on Russian refineries and oil ports.
Higher crude and wholesale fuel prices are quickly reflected in higher pump and heating oil prices for consumers.
In Europe, the main beneficiaries of this crisis are refinery operators, above all the major oil companies. They process crude oil into a wide range of oil products, chiefly diesel and petrol.
In 2026, they are earning exceptionally high excess profits („windfall profits“, „super profits“) at the expense of their customers. Excess profits are additional profits that are earned against the backdrop of a severe crisis and exceed normal profit levels.
The oil companies‘ quarterly reports and statements have been confirming this trend since the summer. After a highly profitable second quarter, the IEA also notes for the third quarter: „Higher product prices relative to those of crude led to exceptionally strong refinery margins in 3Q26.“[1]
A similar trend was observed in 2022. Then, too, geopolitical crises (the loss of Russian oil supplies) led to record profits in the oil industry.[2]
The combination of geopolitically driven supply problems and crisis profits is pushing pump prices sharply higher around the world. Governments are coming under pressure to act and are responding with tax cuts, some of them worth billions, or with caps on fuel prices. As a result, the fallout from the oil price crisis continues to spread.
Skimming off crisis-driven excess profits could help to strengthen public finances, ease the burden on citizens and, ultimately, contribute to Europe’s stability.
The following pages quantify the extent of the excess profits earned by the oil industry in the EU. The precise amount can only be determined in retrospect, once oil companies publish their detailed financial statements next year.
However, robust estimates based on simplified model assumptions are possible almost in real time, allowing the order of magnitude of the excess profits to be estimated reliably. That is the aim of the following pages.
2. Background: The Journey of Oil
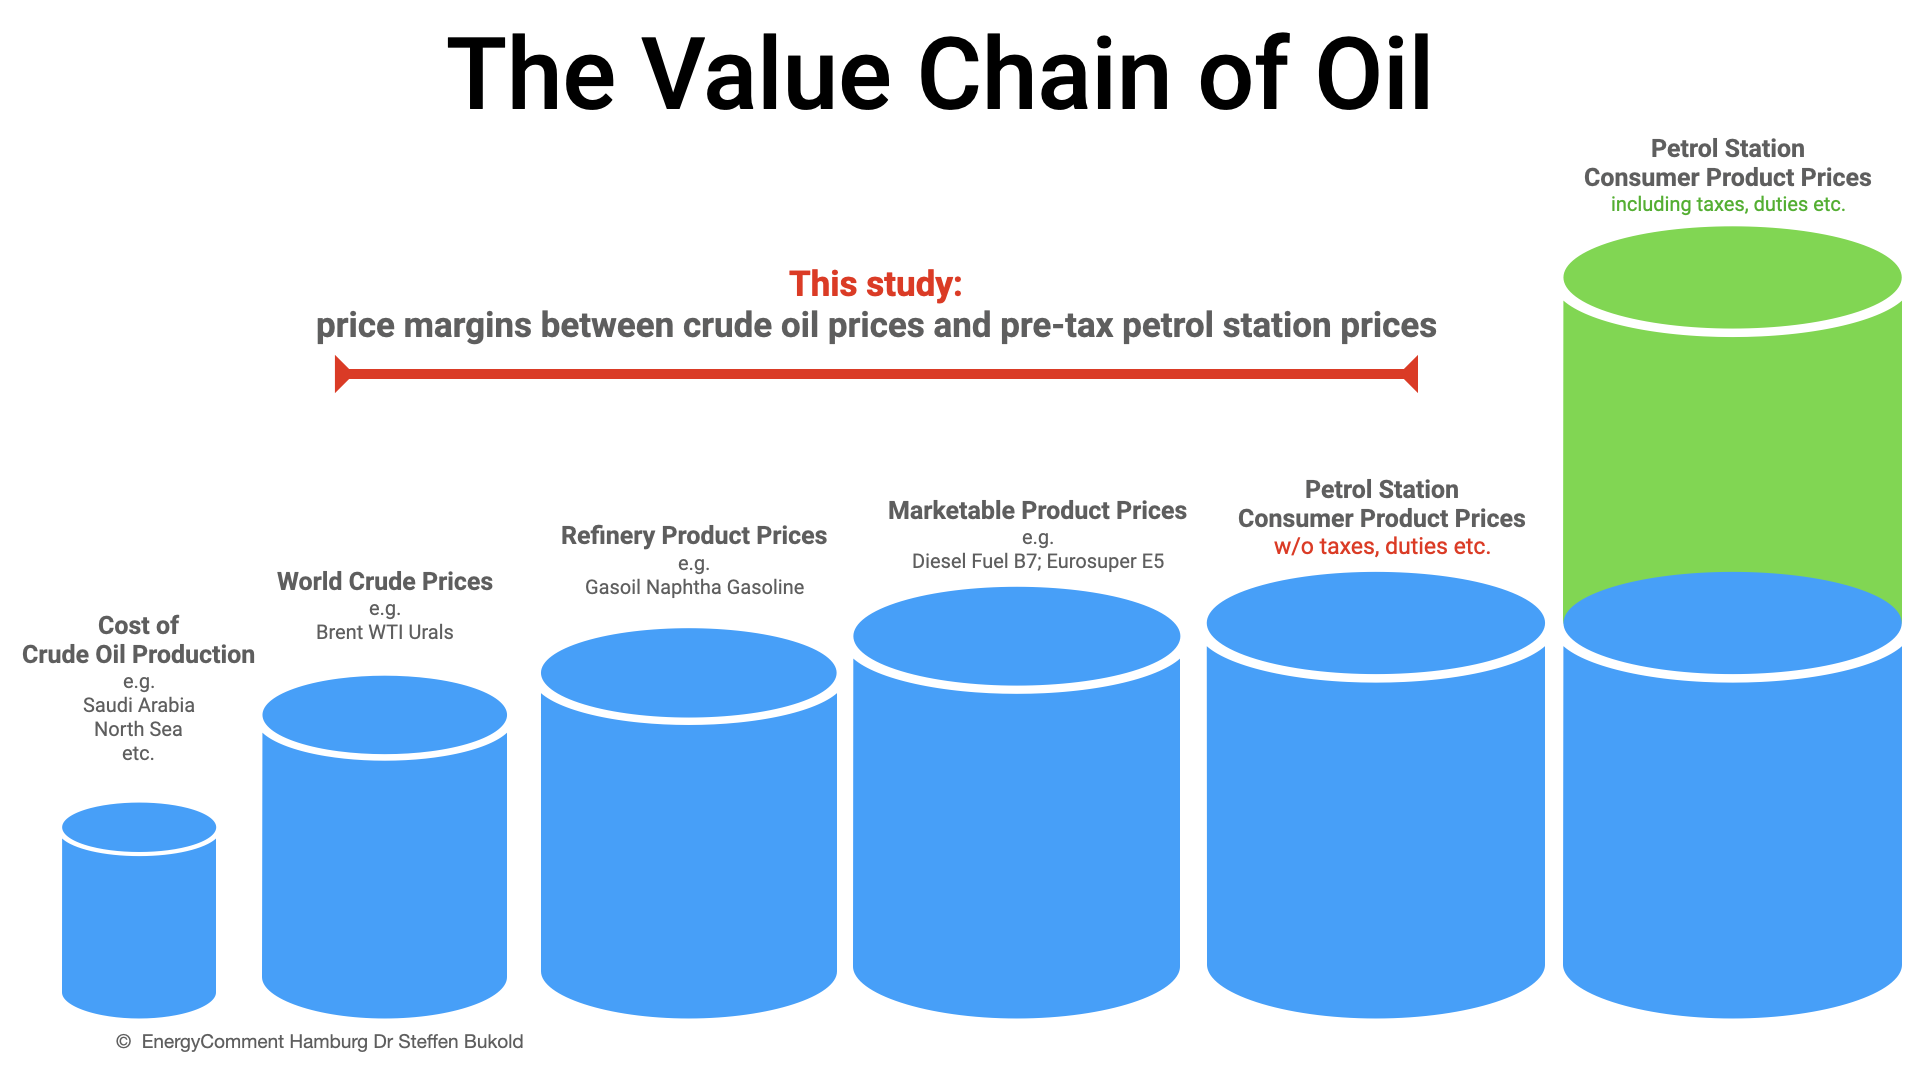
Crude oil passes through a long supply chain involving numerous players and processes before it finally reaches end consumers as fuel or another oil product:
The largest profits are made at the crude oil production stage, as production costs in most parts of the world are far below international crude prices. This segment is dominated by state-owned companies and international oil majors.
The crude oil is then transported by tanker or pipeline to oil refineries, which turn the crude blend into the desired intermediate or end products, such as naphtha, petrol, diesel or jet fuel. In the case of transport fuels, biodiesel/bioethanol and various additives are also blended in. Refiners earn their income from the difference between crude prices and product prices (gross refining margin).
The oil product is then transported to filling stations, either directly from the refineries or via intermediate tank storage facilities.
This analysis focuses on one section of this supply chain: the price spread between crude oil – the refineries‘ feedstock – and net pump prices (see chart).
3. Methodology and Data Sources
3.1 Margin calculation
We compare the situation before the Iran war (January/February 2026) with the crisis months from March onwards (1 March to 19 October 2026): how high was the gross margin per litre of fuel in the retail market before the war, and how high was it afterwards? The gross margin is the price spread between crude oil and the fuel price before taxes and levies.
This shows whether margins, and therefore profits, have risen or fallen over time. Using changes in gross margins as a proxy for changes in operating profits is reasonable, provided other costs remain broadly unchanged. Apart from higher crude prices (which are included in our calculation), no other significant cost increases have been observed (see section 3.2.4 below). However, the results are model estimates, not reported company profits.
In a second step, we multiply this change in margin per litre by sales volumes in each EU member state and for the EU as a whole. This yields the excess profits for the entire retail fuel market in millions of euros.
We therefore do not capture total profits, only the additional profits earned during the Iran conflict over and above pre-crisis levels.
3.2 Data sources
The three key data inputs for the analysis are pump prices (before taxes and levies), sales volumes and crude oil prices.
3.2.1 Pump Prices
Our source for pump prices is the European Commission’s Weekly Oil Bulletin (Prices without taxes).[3] The 27 member states report their pump prices for petrol and diesel to the Bulletin. There are slight methodological differences between member states in how pump prices are collected, but since this analysis only considers price changes over the current year rather than absolute price levels, these differences carry little weight.
3.2.2 Fuel Consumption Data
For fuel volumes by member state, we use Eurostat data. These cover motor gasoline and diesel fuel used in road transport, excluding biofuels. The most recent Eurostat release covers data for 2024.
The IEA’s monthly oil market reports for Europe show that motor gasoline consumption has remained very stable since 2024 and, as far as can be seen so far, has not been dampened by this year’s high pump prices.
For road diesel, too, the IEA notes that, according to preliminary data, sales may have fallen by only 2% during the crisis period. This is within the margin of error. After a similarly steep price rise shortly after the outbreak of the war in Ukraine in 2022, fuel volumes likewise remained close to the previous year’s levels.[4]
We therefore consider the latest Eurostat data a suitable source for fuel consumption volumes. As is usual in the oil market, precise data will only become available in retrospect and with some delay.
3.2.3 Crude oil prices
We assume that imported crude is processed in refineries and sold on without significant delay. We therefore use the average crude price over the preceding seven days (five trading days plus the weekend).
In determining crude input, we also take into account mass losses in refining processes and the difference in density between diesel and petrol. All dollar prices were converted into euros at the ECB’s daily reference rate.
Our source for crude prices is the ICE exchange (via Bloomberg). We use front-month ICE Brent crude futures as a proxy for crude prices. In many market situations, they offer greater transparency and are more meaningful than the opaque Dated Brent market and other spot prices, which are susceptible to distortion.
In the North Sea spot market, limited individual offers can distort the assessments of the price reporting agencies (S&P Global Platts, Argus Media) and cause a price squeeze. Trading volumes during these price spikes can be extremely low.[5]
Dated Brent and other spot prices nevertheless provide a better indication of the marginal cost of securing additionalprompt physical barrels than ICE futures prices.
Both approaches – ICE Brent futures and Dated Brent/Brent spot – therefore have their pros and cons. Saudi Arabia, for example, prices its crude exports to Europe off ICE Brent futures. Some other countries prefer Dated Brent.
For the German crude market, for example, the differences are limited. According to the Federal Statistical Office, actual crude import prices in Germany, the EU’s largest oil market, rose by 46% during the crisis (Jan/Feb 2026 vs Mar–Aug 2026). Brent spot prices rose by 44% (in euro terms) and the front-month ICE Brent futures contract by 42% (in euro terms).[6]
In recent weeks, spot prices have been well above futures prices, as some European refiners had to replace lost Saudi cargoes at short notice. It is unclear, however, what volumes were actually sold at high spot prices.
Trading statements from major oil companies show that refining margins rose again in the third quarter and that trading profits remained high. This suggests that Europe’s large refiners have not only been able to mitigate the risks of high crude spot prices but have even increased their profits further.
TotalEnergies, for example, reported a rise in its European Refining Margin Marker (ERM) from $13.5/b in the second quarter to $33.2/b in the third quarter. Shell expects its Indicative Refining Margin to rise from $24/b to $42/b in the third quarter.[7]
3.2.4 Refinery gross margins and excess profits
As mentioned, our analysis focuses on the oil industry’s gross margins in the fuel market. These correlate very closely with operating profits, as refinery costs remained largely stable over the period under review, apart from higher crude prices, which were of course taken into account.
Natural gas prices in the EU have also risen sharply alongside oil prices. Refineries use large amounts of gas. However, most of the gas they need is produced internally as a by-product of refining processes.
Externally purchased natural gas accounts on average for only a small share of refinery costs. For 2021, Germany’s Federal Cartel Office (Bundeskartellamt) put this share at just 1.1% for the large and heterogeneous German refining market. Even if gas prices were to double or triple, their impact on refinery profits would therefore remain small.[8]
Higher gas prices can also be offset by greater use of refinery gases or other residues suitable for generating steam and power or for use as feedstock. These options were used in 2022, albeit at much higher gas prices than today. In a broader context, almost all oil majors are also active in the natural gas business, so higher gas prices lead to higher group profits. This aspect, however, lies outside the scope of this study.
We are not aware of any other factors that could have led to significantly higher refinery costs from March 2026 onwards, and to our knowledge none have been mentioned in statements by the oil industry. Higher freight rates on the Rhine affected only certain sub-markets in some regions of the EU, and only for a limited period.
We therefore assume a very high correlation between higher gross margins in the fuel market and higher operating profits in the oil industry.
4. Results
4.1 EU-wide excess profits
Excess profits from petrol and diesel sales rose to an interim high of €4,916mn in April 2026, driven mainly by the extreme rise in diesel prices. It was not until August and September that diesel excess profits reached new record levels.
Excess profits from petrol sales started from a comparatively low level of €132mn in March. They then rose steadily to €1,638mn in September.
Total excess profits jumped to their highest monthly level so far in September, at more than €7.3bn (€7,321mn). Initial data for October (1-19) suggest that excess profits will remain high.
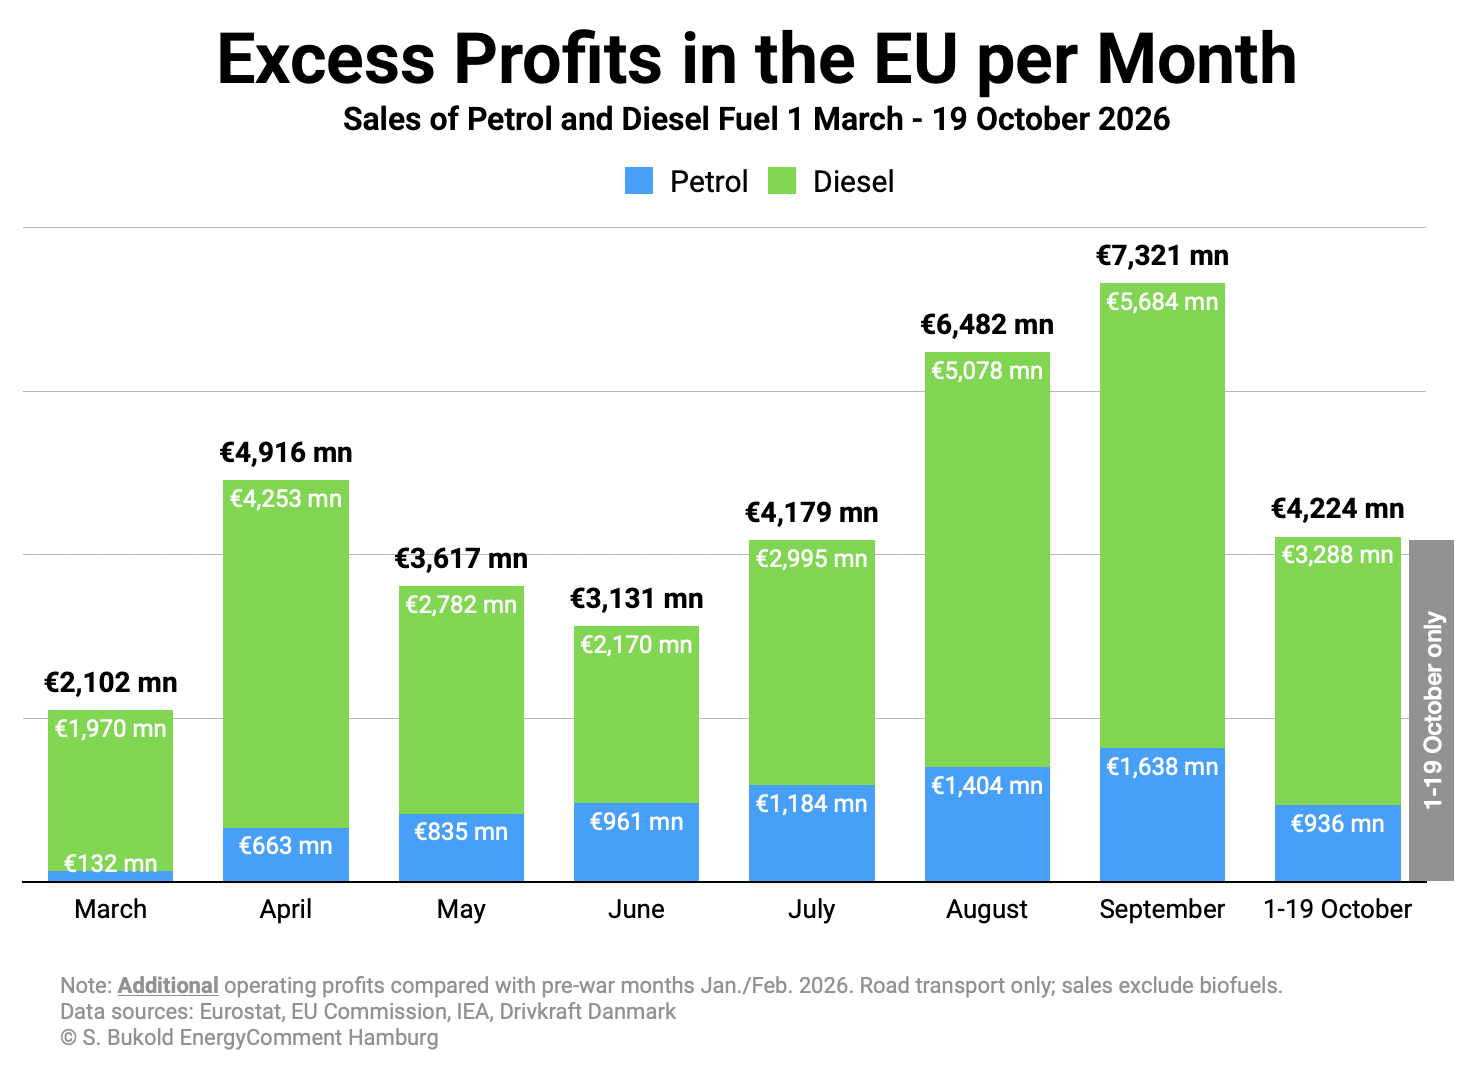
Adding up excess profits from 1 March to 19 October 2026 gives a total of around €36bn for the EU as a whole. Diesel sales account for around €28.2bn of this total, while excess profits in the petrol market came to just under €7.8bn.
The excess profits in the EU calculated by the Brussels-based NGO Transport & Environment (T&E) are below our figures, despite a similar methodology (T&E: €28.8bn for the period 1 March to 12 October; our result: €36.0bn for the period 1 March to 19 October).[9]
The difference is largely explained by T&E’s use of Brent spot prices for crude, whereas we use ICE Brent futures. Both approaches have advantages and disadvantages (see section 3.2.3).
4.2 Excess profits in EU member states
The scale and structure of excess profits vary from country to country.
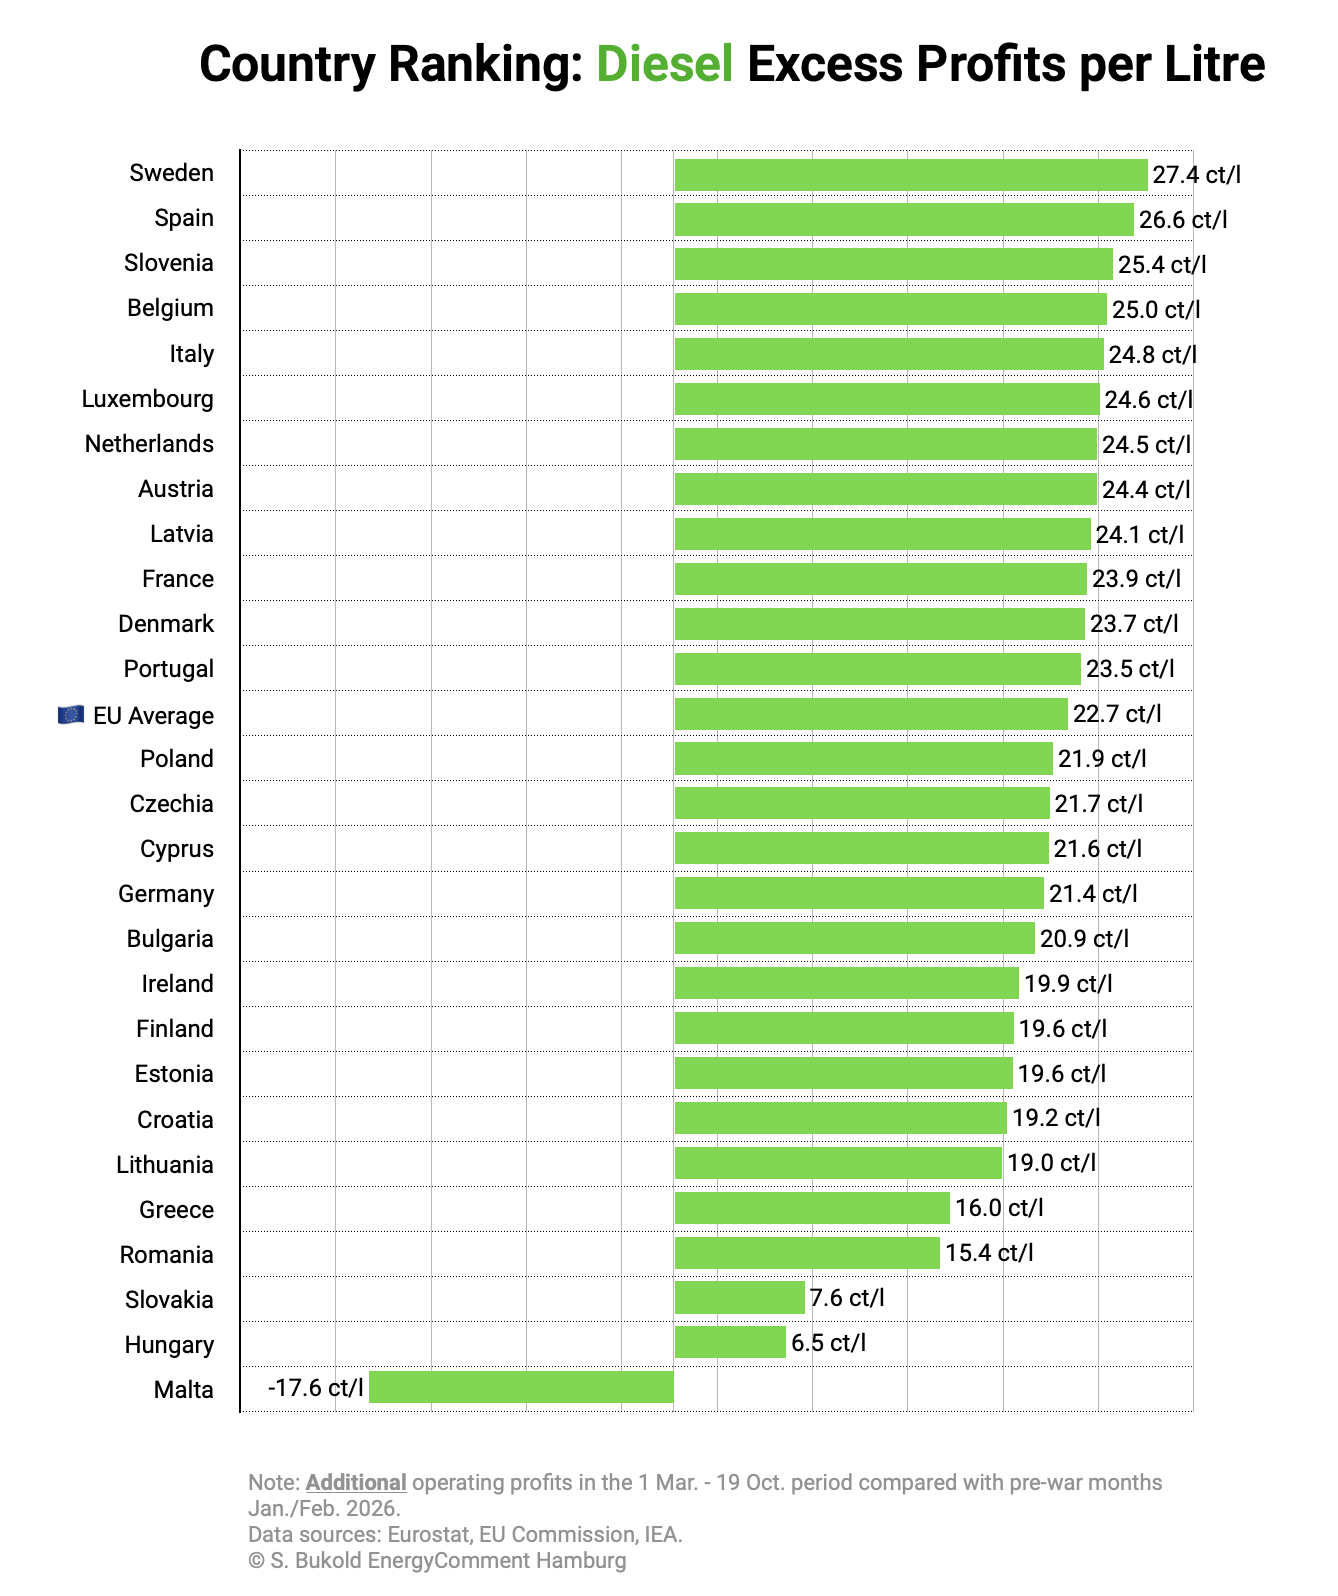
We begin with excess profits per litre of diesel. The additional profit per litre was highest in Sweden and Spain. At the other end of the scale is Malta, where pump prices are fixed. Prices for each fuel were held constant throughout the period, regardless of international developments. Hungary and Slovakia saw comparatively low excess profits as a result of government intervention in the market.
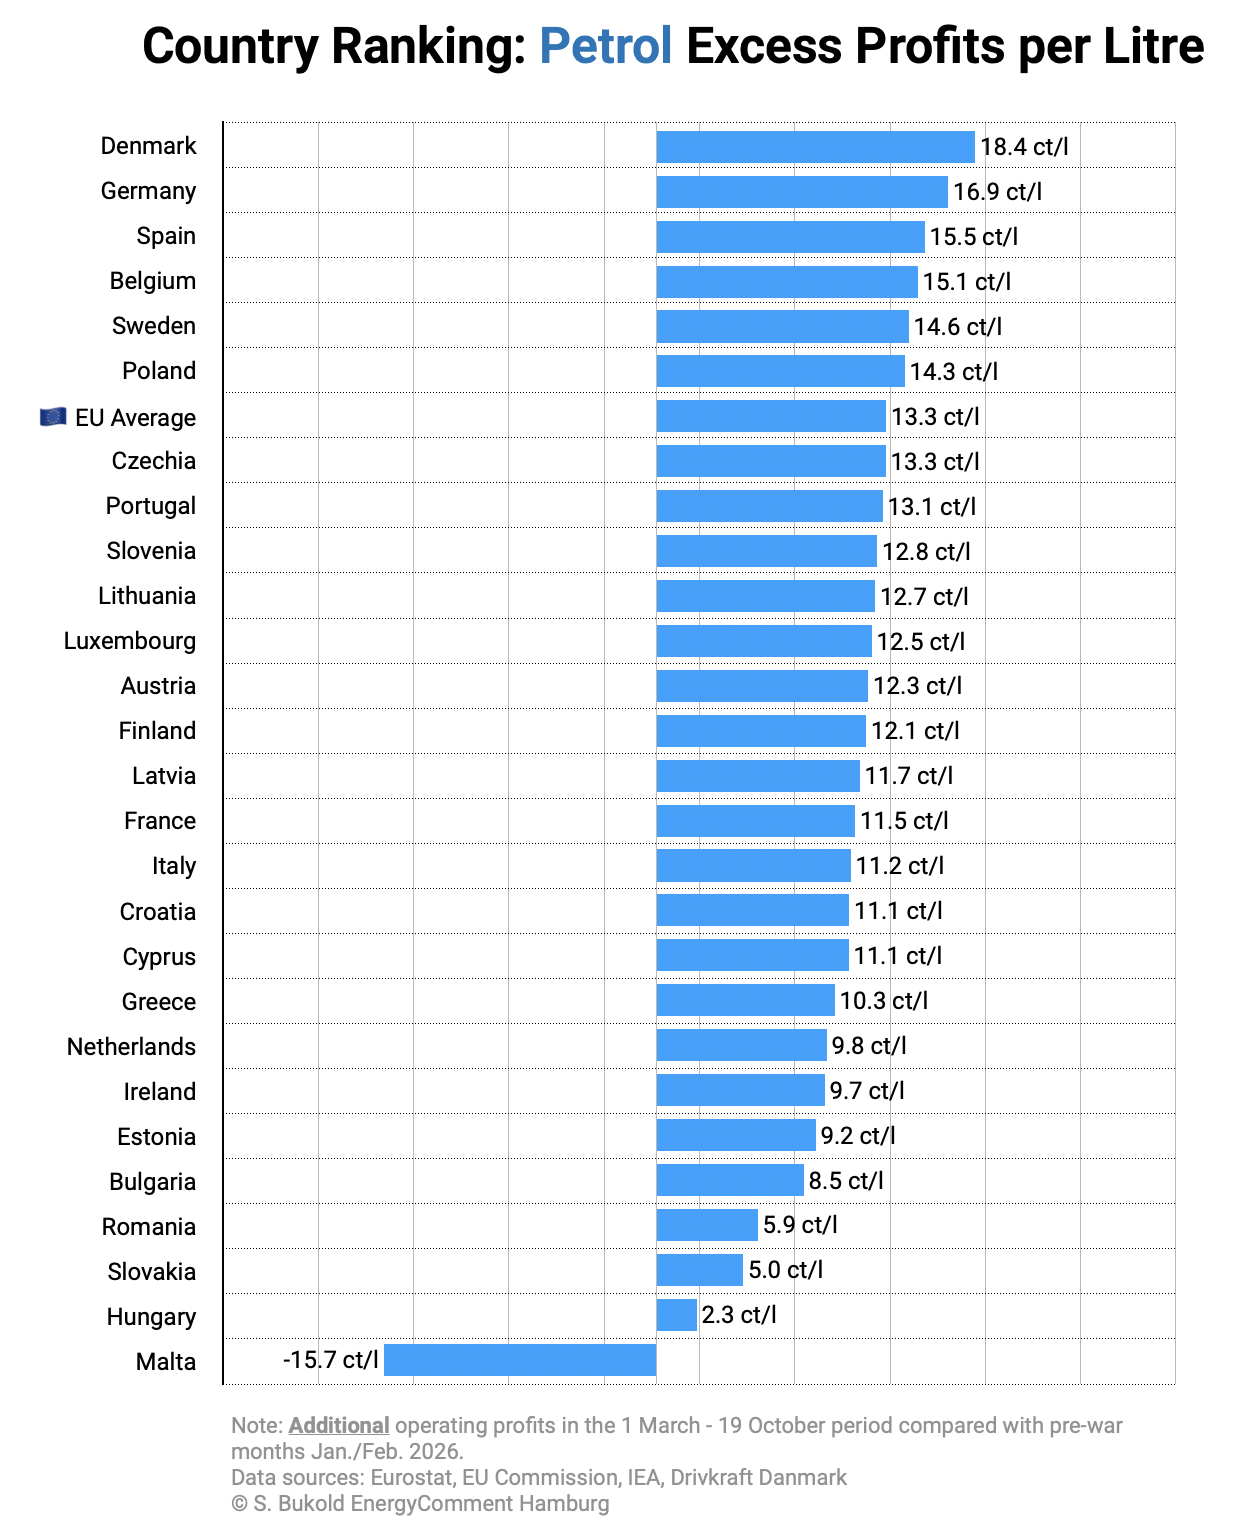
In the petrol market, too, Malta stands out because of its fixed-price policy. In Hungary and Slovakia, government intervention again curbs the scale of excess profits.
A comparison of the EU’s large fuel markets shows that excess profits per litre of petrol in Italy and France are below those in Germany and Spain.
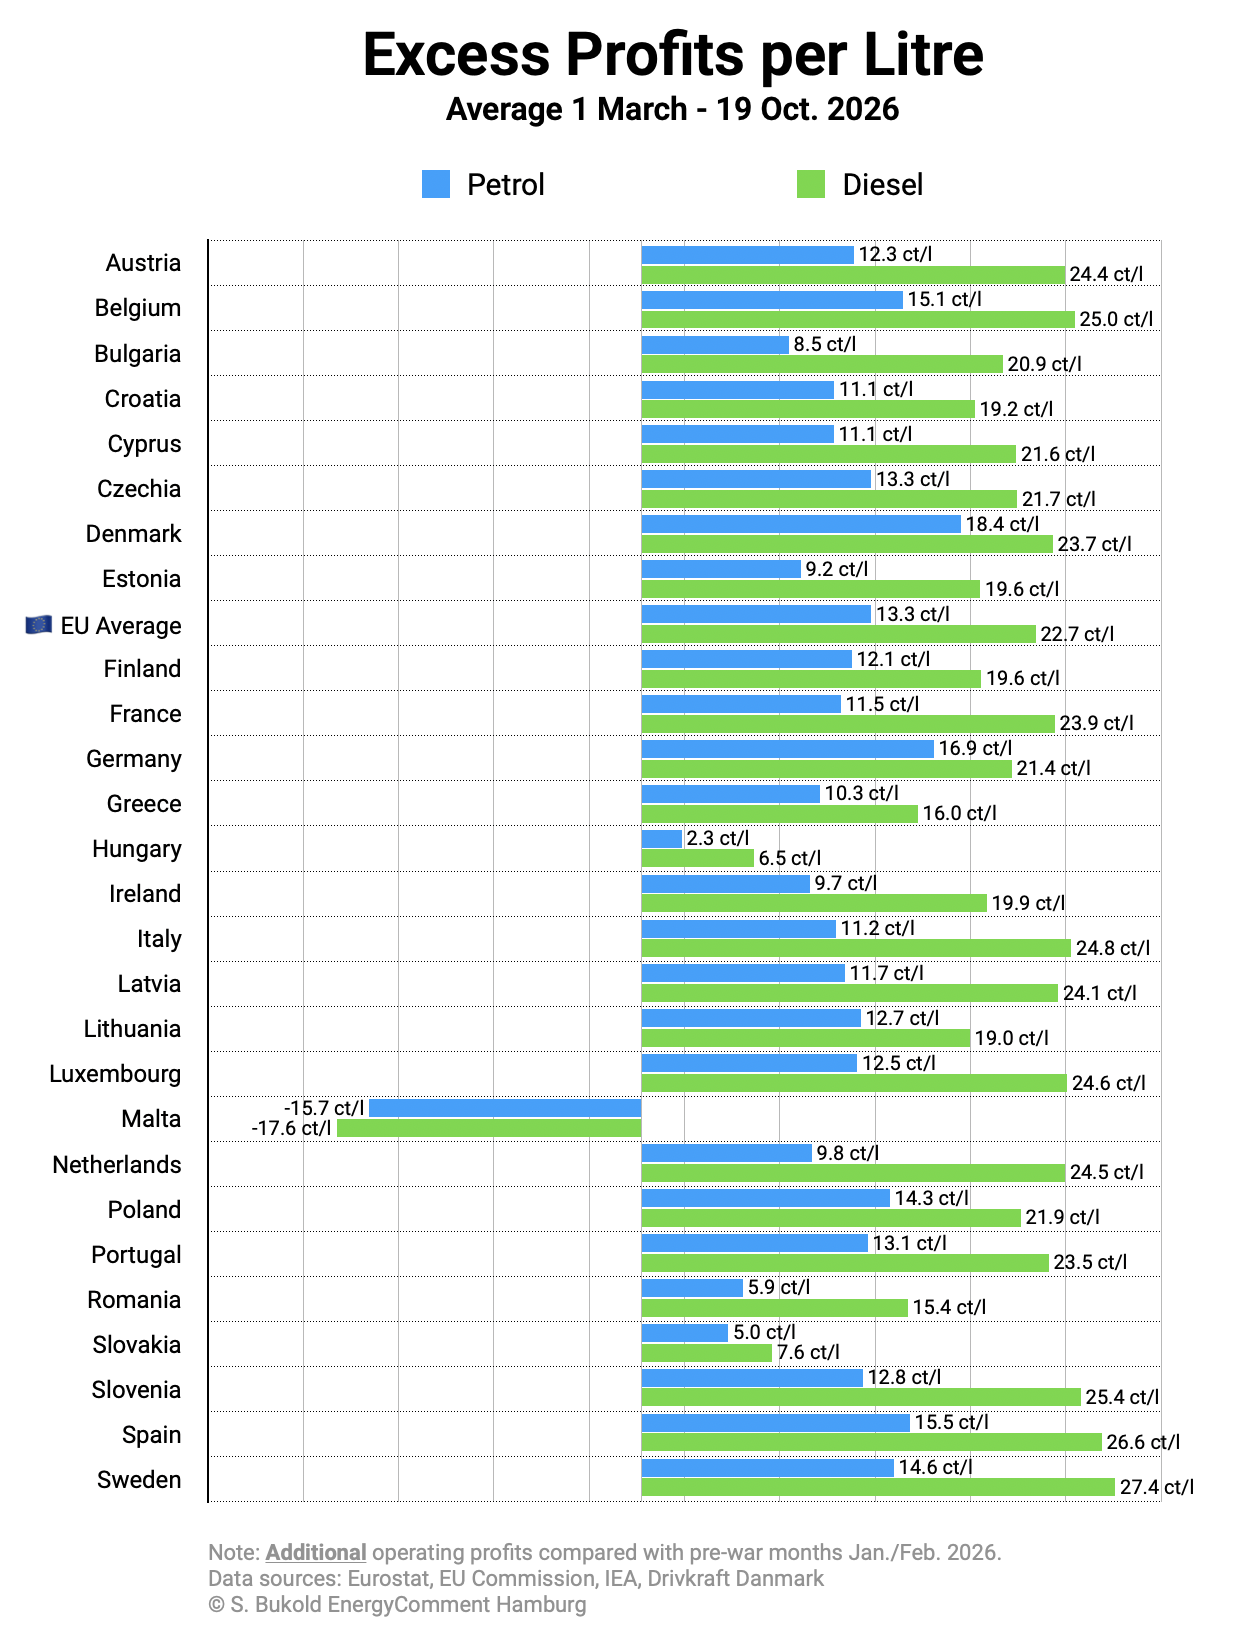
Presenting the estimated additional margins for petrol and diesel side by side, the next chart shows at a glance that, with the exception of Malta, the oil industry has increased its profits significantly, and in some cases sharply, in every EU member state compared with the pre-war months. The scale varies, but the trend is visible across Europe.
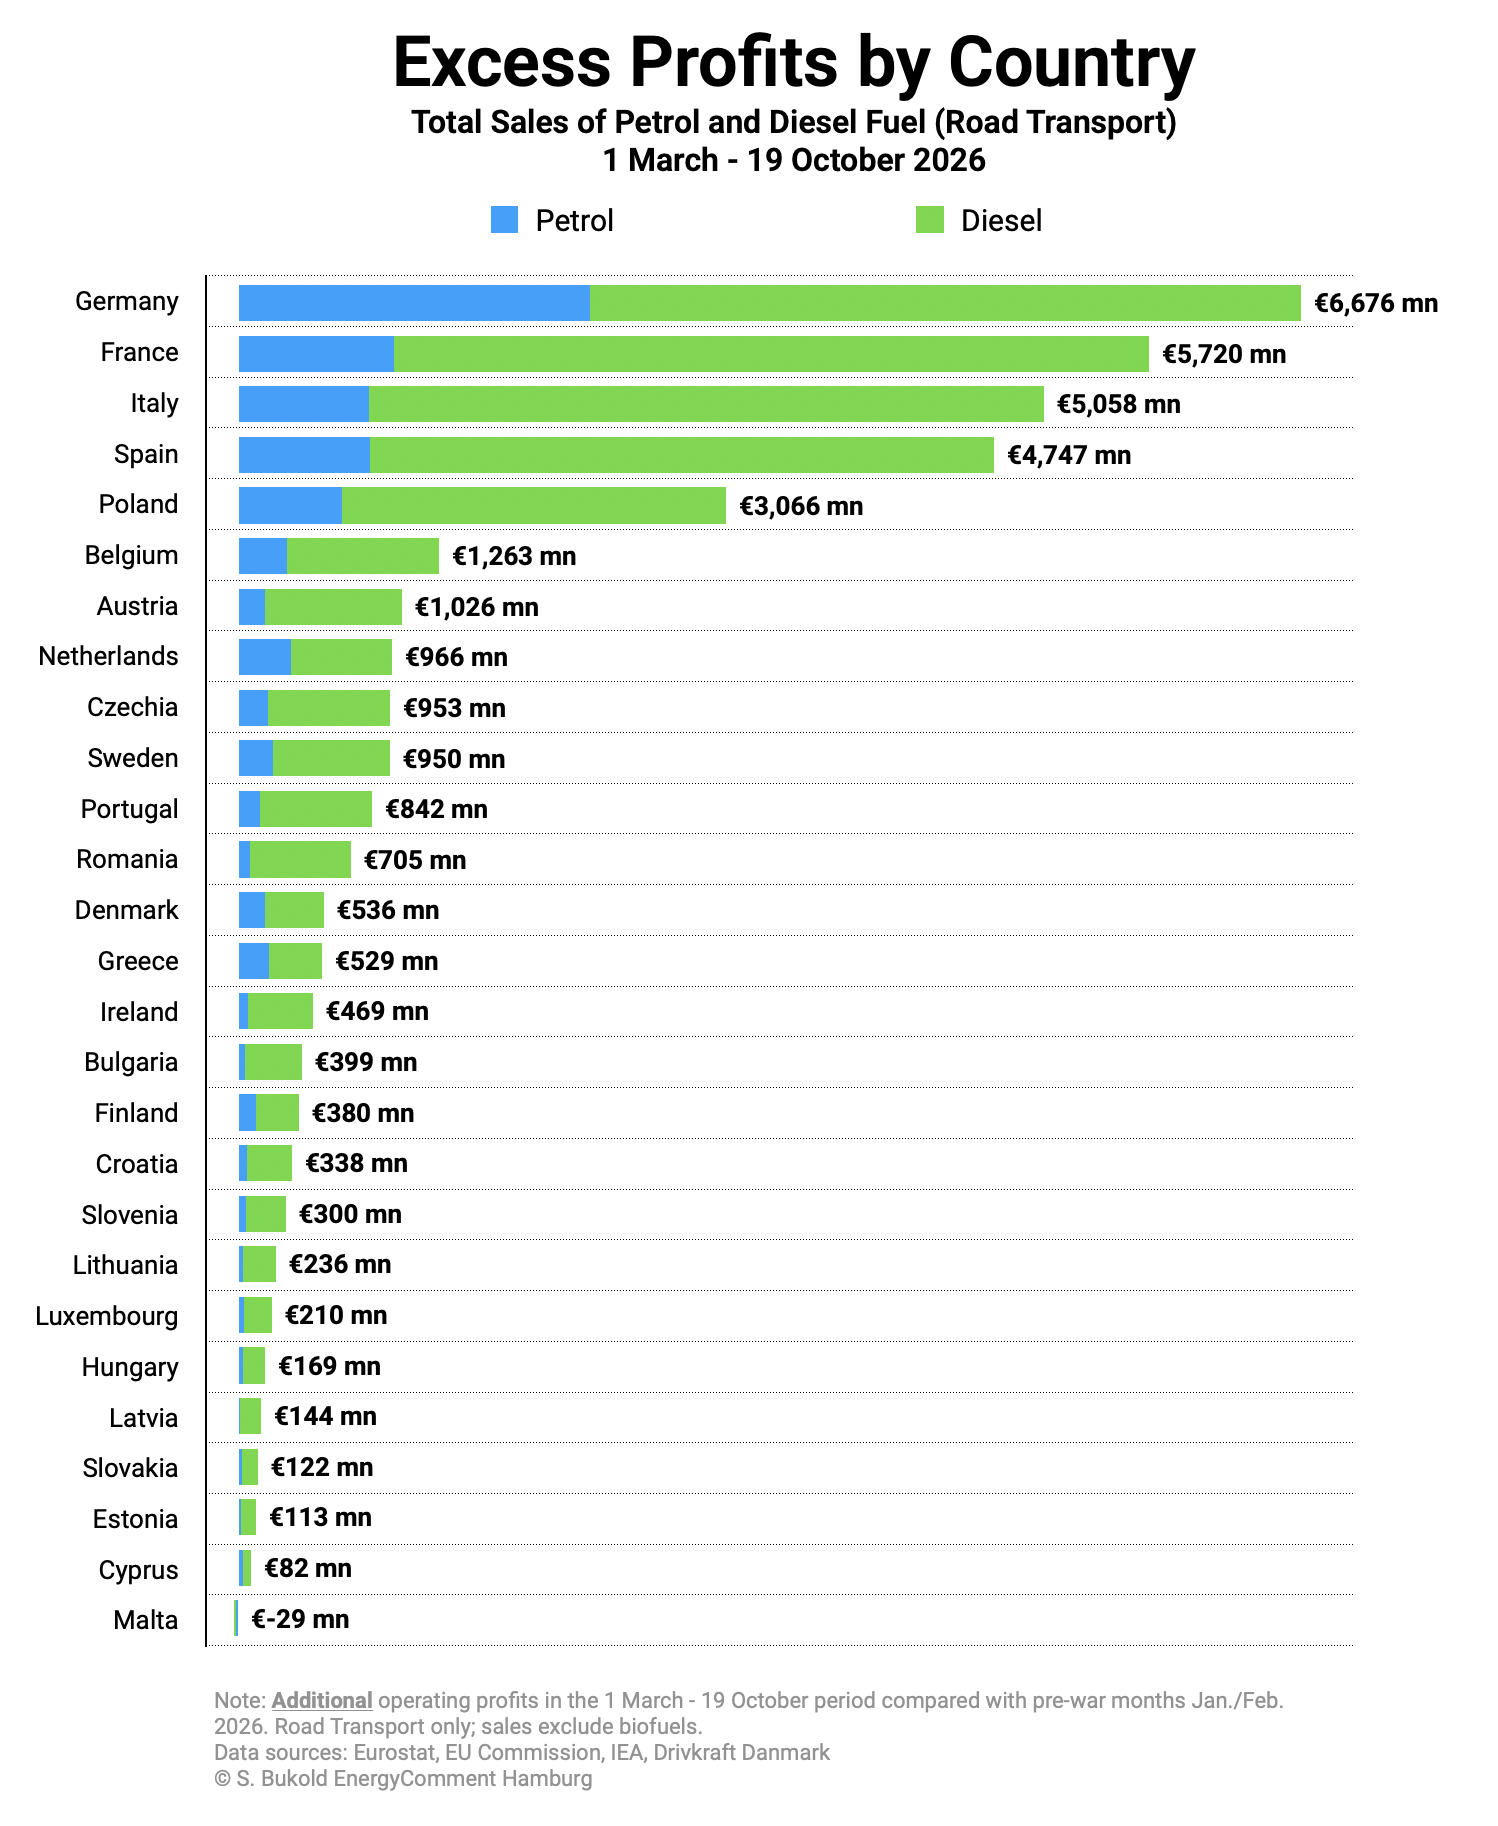
The next chart shows cumulative excess profits by country, i.e. the sum of excess profits from petrol and diesel sales during the Iran crisis (1 March to 19 October).
As expected, the large fuel markets show the highest excess profits: just under €6.7bn in Germany, just above €5.7bn in France, over €5.0bn in Italy and more than €4.7bn in Spain. In all countries (excluding Malta), the bulk of excess profits comes from the diesel market, where larger consumption volumes and higher margins per litre work in the same direction.
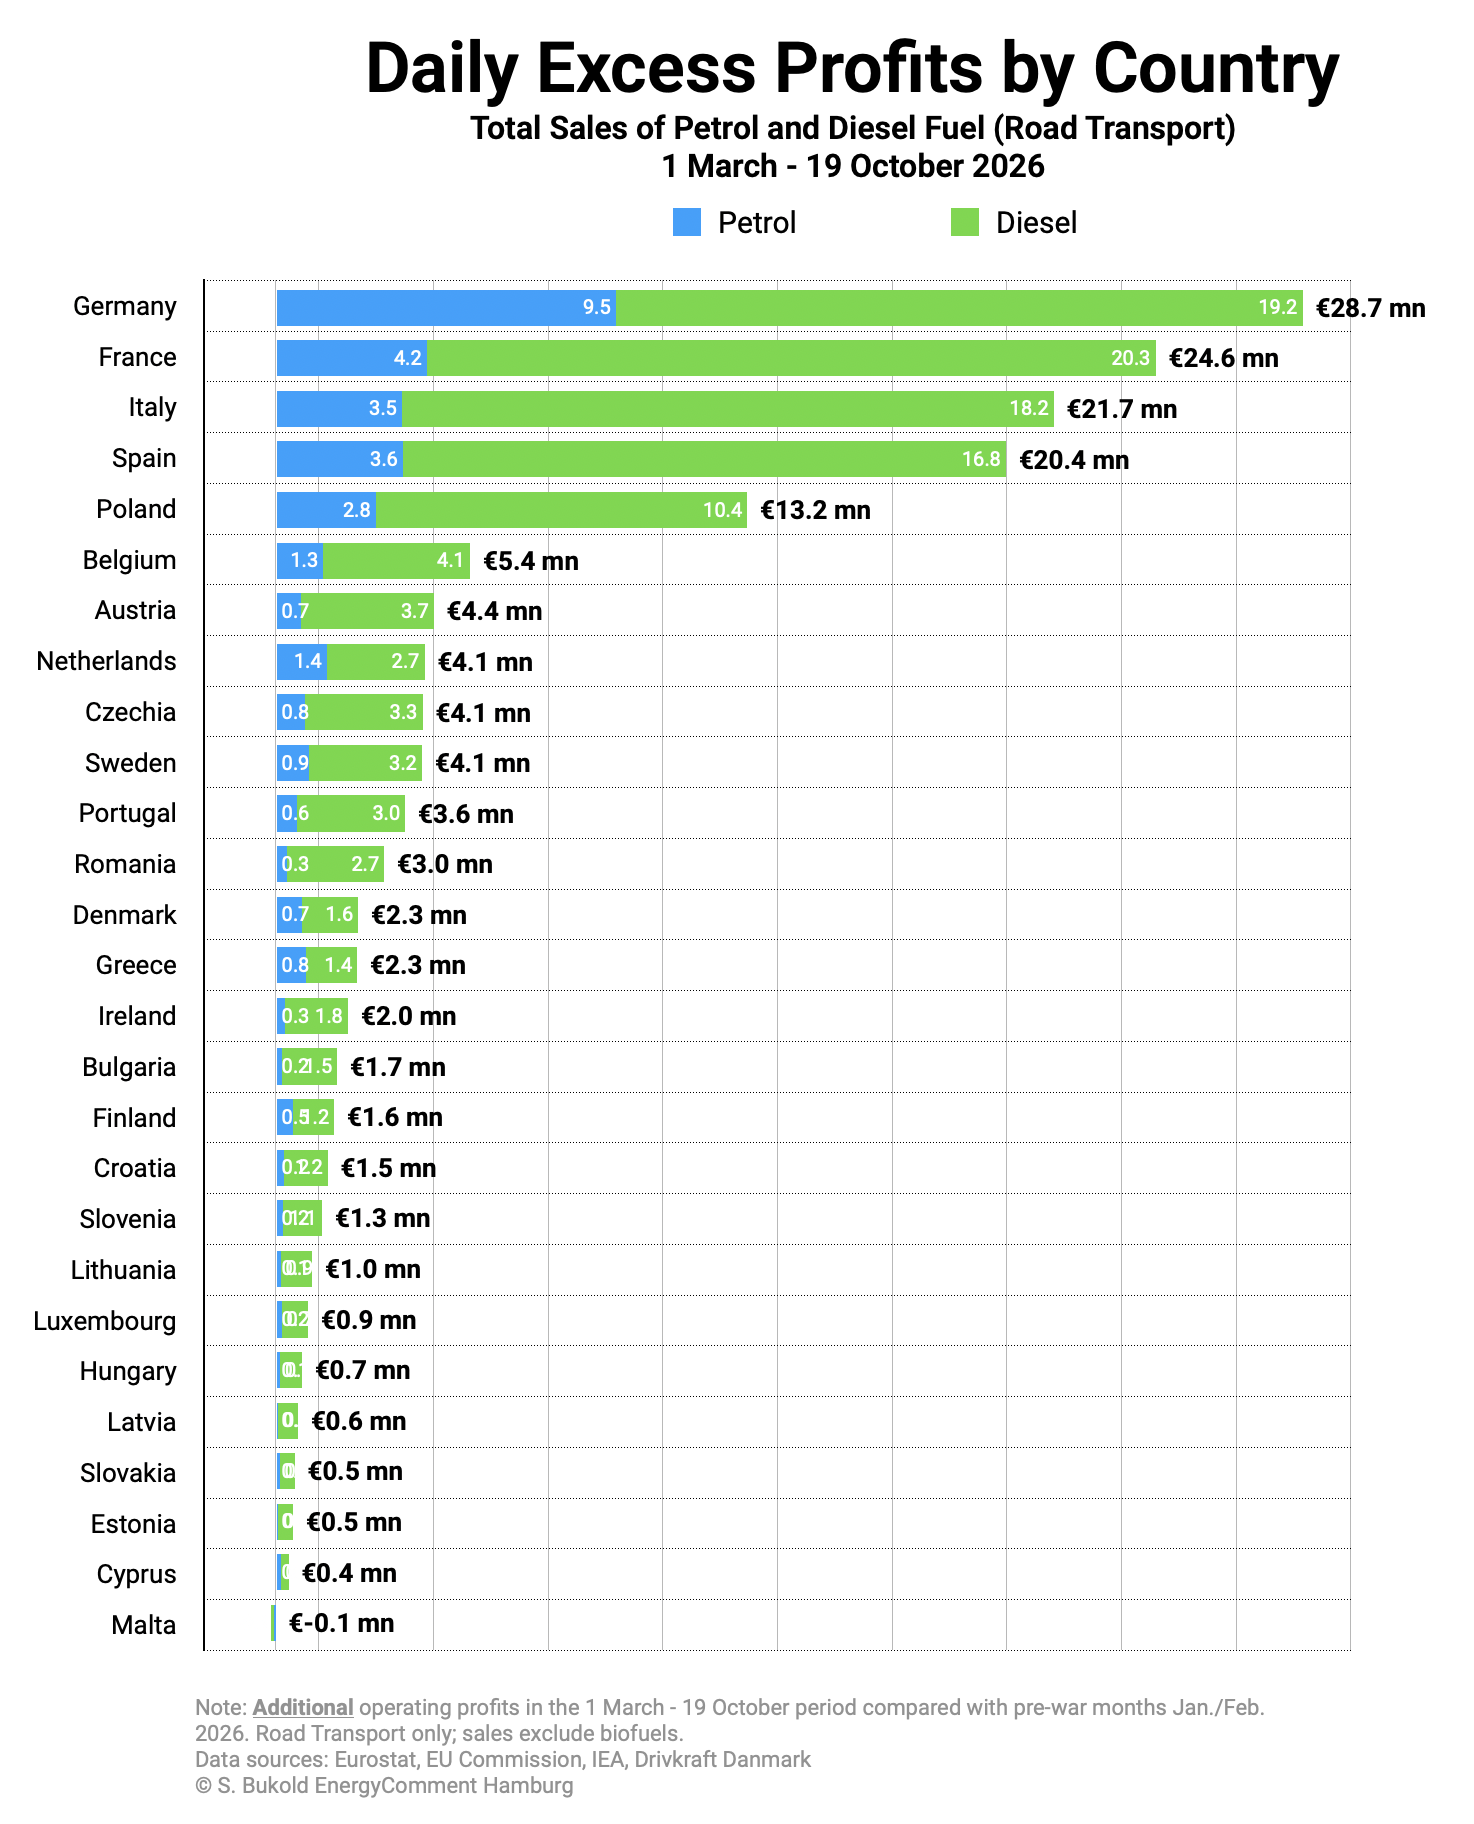
The following chart converts the total excess profits from the previous chart into daily excess profits.
Across the EU, the oil industry generated average daily excess profits of €33.3mn in the retail petrol market and €121.1mn in the retail diesel market, a combined total of €154.4mn per day.
Among the member states, the figures range from €28.7mn a day in Germany to minus €0.1mn a day in Malta.
Endnotes
- IEA: Oil Market Report October 2026, Paris 2026↩︎
- S. Bukold: Excess Oil Profits in Times of War. An EU-wide snapshot of higher margins on the sale of diesel and petrol since the beginning of the Iran war, Hamburg, 30 March 2026; S. Bukold: Oil Profits in Times of War. An EU-wide analysis of higher margins on the sale of diesel and petrol since the beginning of the Ukraine war, Hamburg/Vienna 2022; S. Bukold: The Dirty Dozen. The Climate Greenwashing of 12 European Oil Companies, Hamburg/Vienna 2023.↩︎
- https://energy.ec.europa.eu/data-and-analysis/weekly-oil-bulletin_en; the petrol pump prices reported for Denmark appear to contain a calculation error from late May onwards. We have replaced them with national data (Drivkraft Danmark list prices minus a typical discount); we also had to replace the Bulletin’s EU-wide figures with an aggregate of the 27 member states. The discrepancy between the Bulletin and our analysis is probably due to a different weighting of national fuel sales volumes.↩︎
- IEA: Oil Market Report October 2026, Paris, 14 October 2026; for Germany, see: https://www.spiegel.de/mobilitaet/autofahrer-in-deutschland-lassen-den-wagen-kaum-stehen-trotz-hoher-spritpreise-a-64f1d30e-341e-47c9-920f-876259b70586; figures from Germany’s official oil statistics (Amtliche Mineralölstatistik) also show that motor gasoline consumption in the first half of 2026 was only 1% below the previous year’s level (www.bafa.de).↩︎
- WTI Midland (US) accounts for the largest share of volumes in the Dated Brent basket. When no US cargoes are available, price discovery for Dated Brent therefore has to rely on sporadic offers of crude cargoes.↩︎
- Data sources: www.destatis.de; www.eia.gov, www.ice.com↩︎
- https://www.bloomberg.com/news/articles/2026-07-16/totalenergies-flags-strong-oil-trading-as-iran-war-roils-market; https://www.shell.com/news-and-insights/newsroom/news-and-media-releases/2026/shell-third-quarter-2026-update-note.html; https://totalenergies.com/investors/results-investor-presentations/main-indicators↩︎
- Bundeskartellamt: Ad-hoc Sektoruntersuchung Raffinerien und Kraftstoffgroßhandel – Zwischenbericht, 2022. A 30% rise in natural gas prices increases gas procurement costs at Germany’s PCK Schwedt refinery by the equivalent of just 0.13 euro cents per litre – PCK Raffinerie GmbH: Jahresabschluss zum Geschäftsjahr vom 01.01.2024 bis zum 31.12.2024 Schwedt/Oder, 11 August 2025. See also: N. Gudde, J.-F. Larivé and M. Yugo: CO2 reduction technologies. Opportunities within the EU refining system (2030/2050), Concawe, Brussels, July 2019.↩︎
- https://www.transportenvironment.org/topics/energy/oil↩︎