
Author:
Dr Steffen Bukold
EnergyComment Hamburg
Commissioned by
Greenpeace e.V. Hamburg
Executive Summary
Shortly after the outbreak of the Iran war on 28 February 2026, fuel prices at petrol stations across the EU rose steeply. The following analysis shows that this increase cannot be explained by higher crude oil prices alone.
In addition, the oil companies significantly widened their profit margins, thereby generating excess profits.
During the first three weeks of the war, the average excess profits amounted to €81.4 million per day. The largest share of these excess profits was attributable to diesel fuel.
Margins were expanded predominantly in countries with high purchasing power: the Netherlands, Sweden, Denmark, Austria and Germany. At the same time, there were a number of mostly smaller markets in which margins actually shrank.
When the higher margins are combined with fuel consumption volumes, the data show that roughly 30 per cent of all EU-wide excess profits in the petrol station market were borne by Germany.
1. Research Question: What is this analysis about?
The outbreak of the Iran war on 28 February 2026 triggered a dramatic surge in global oil and gas prices. The International Energy Agency (IEA) has already described it as the most severe crisis in the history of the oil industry.[1]
Almost overnight, Europe was reminded of how dependent its economy and society still are on fossil energy imports. The lessons of the Ukraine war and the loss of Russian oil and gas supplies seemed to have already been forgotten.
Petrol station prices across the EU responded immediately. Within a matter of days they climbed to their highest level since 2022, the first year of the Ukraine war.
At that time, many oil companies in Europe recorded the highest profits in their corporate history. Inflated fuel prices and exceptionally wide refinery margins played a central role. The accusation was initially denied in the spring of 2022, but within a few months the evidence was clearly visible in corporate financial reporting.[2] The parallels even extend to the ranking of countries most severely affected by the margin expansion.[3]
Is this pattern repeating itself in 2026?
The following pages show that petrol station prices in the EU have once again moved far away from their cost base during March 2026, albeit with considerable variation across national markets.
As early as the first days of March 2026, the IEA noted that refinery margins had returned to their record levels of 2022. The crisis had generated „sharply higher profits“ for the oil majors. The price spread between crude oil and gasoil/diesel (the gross margin) doubled in Europe from 25 $/b (dollars per barrel oil) in February to more than 50 $/b within the first days of March, according to the IEA, and has continued to widen since.[4]
It should also be borne in mind that the oil majors are currently generating higher profits not only in the downstream segment, i.e. refineries and petrol stations, but also in the upstream segment, i.e. in the production and marketing of crude oil and natural gas.
An additional source of profit is trading and speculation, as the large oil companies are able to leverage their information advantage and their control over many elements of the value chain to an even greater degree in a turbulent market environment.
But what does the situation in the European petrol station market actually look like?
This short study quantifies the increase in margins and the scale of excess profits earned by the oil companies during the first three weeks of March 2026. How much have profit margins grown compared with the pre-war months?
The figures presented below can be no more than a rough snapshot. The observation period is short and we have had to work with simplifying assumptions. Nevertheless, the results provide a first impression of the magnitude of the profit increase and the geographical distribution of profits across the EU.
2. Background: The Journey of Oil
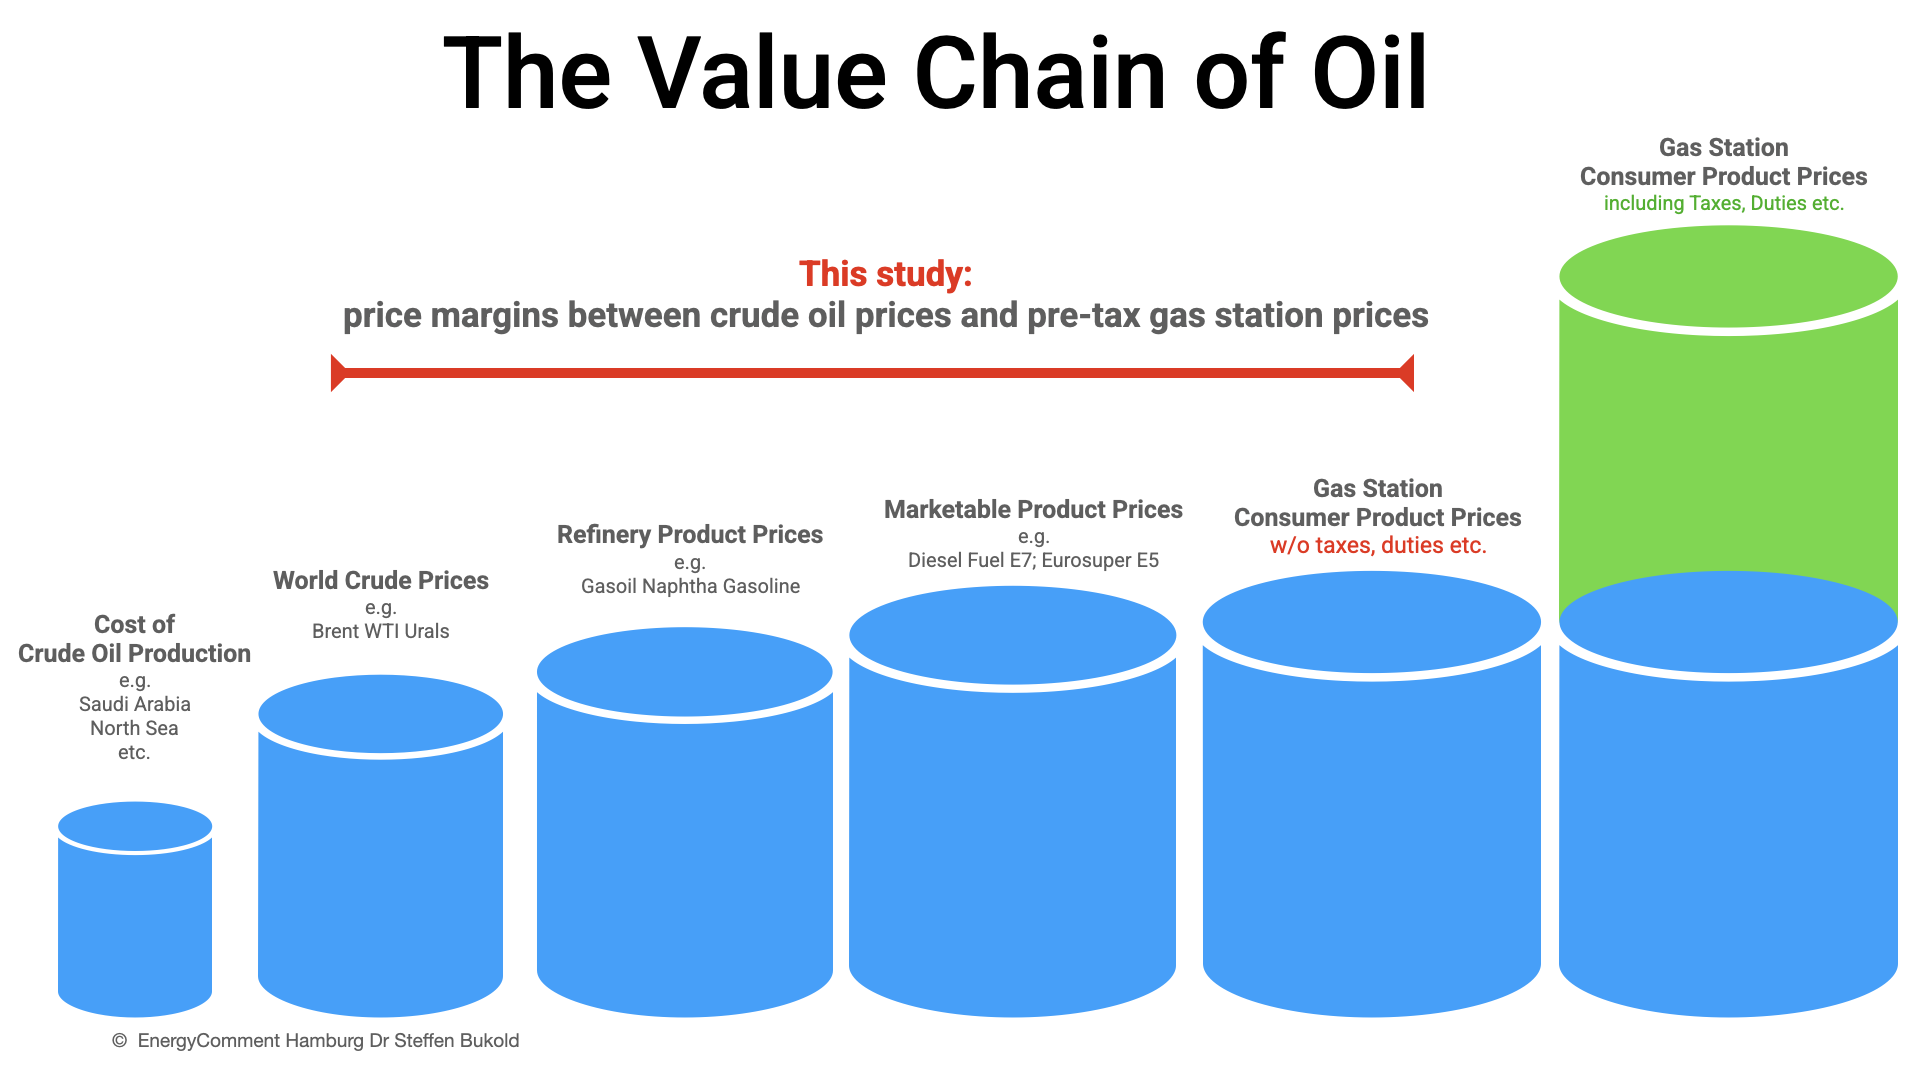
Crude oil passes through a long supply chain involving numerous actors and processes before it finally arrives at petrol stations as a marketable fuel:
- The largest profits are generated at the production stage, since the cost of extraction in most regions of the world lies far below international crude oil prices. State-owned oil companies and international oil majors dominate this segment.
- The crude oil is then transported by tanker or pipeline to oil refineries, which convert the crude oil blend into the desired intermediate or end products.
- Oil refinery operators, in Europe typically the oil majors, finance their operations through the price differential between crude oil prices and product prices (gross refinery margin).
- Refinery products are then processed into end products. In the case of motor fuels, biodiesel or bioethanol is blended in.
- The final fuel products (diesel, petrol/gasoline) are then transported directly or via intermediate storage facilities to petrol stations, sold and combusted in vehicle engines.
3. Our Approach: How Do We Calculate Excess Profits?
We focus on one segment of this supply chain: the price spread (gross margin) between crude oil prices and petrol station prices (excluding taxes and duties).
- We compare the situation before the Iran war (January and February 2026) with the first three weeks of the war in March (2-23 March) and calculate the average price spreads (not the price levels!) between petrol station prices and crude oil prices for both periods.
- We then compare the margins in March with the margins in the pre-war months (January/February) in euro cents per litre.
- In the final step, we multiply these per-litre figures by the average daily sales volumes in the European petrol station market.
A detailed description of data sources and methodology can be found in Chapter 5. The author is happy to answer further questions.
4. Results: Excess Profits in the EU
4.1 EU-wide Excess Profits
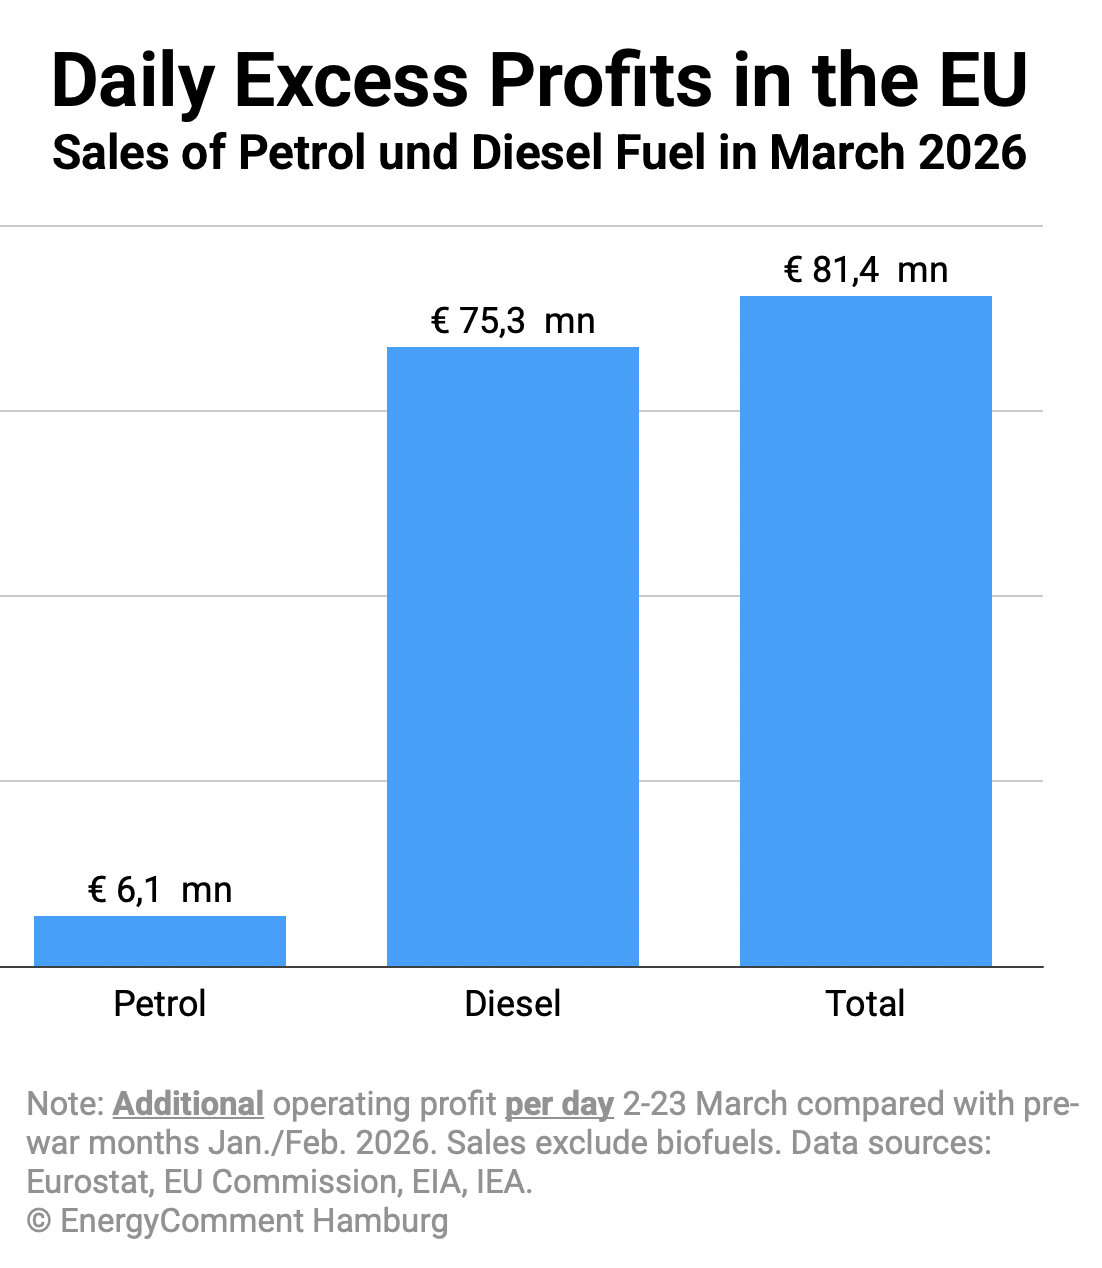
The chart below shows the average daily excess profits across the entire EU during the first three weeks of the war. It is immediately apparent that excess profits were generated predominantly in the diesel market.
Compared with the pre-war months, the oil companies earned a daily excess profit of €75.3 million from the sale of diesel fuel to cars and trucks. Petrol sales contributed €6.1 million per day.
The combined excess profit thus amounts to €81.4 million per day.
If this level persists, the oil companies can expect additional operating profits of approximately €2.5 billion for the month of March alone.
Chapter 5 explains in more detail why we assume that the margin expansion translates directly into higher operating profits. This increase will become clearly visible ex post in the financial reporting of the oil companies, just as it did in 2022 after the outbreak of the Ukraine war.
4.2 Country Data: Margin Increase
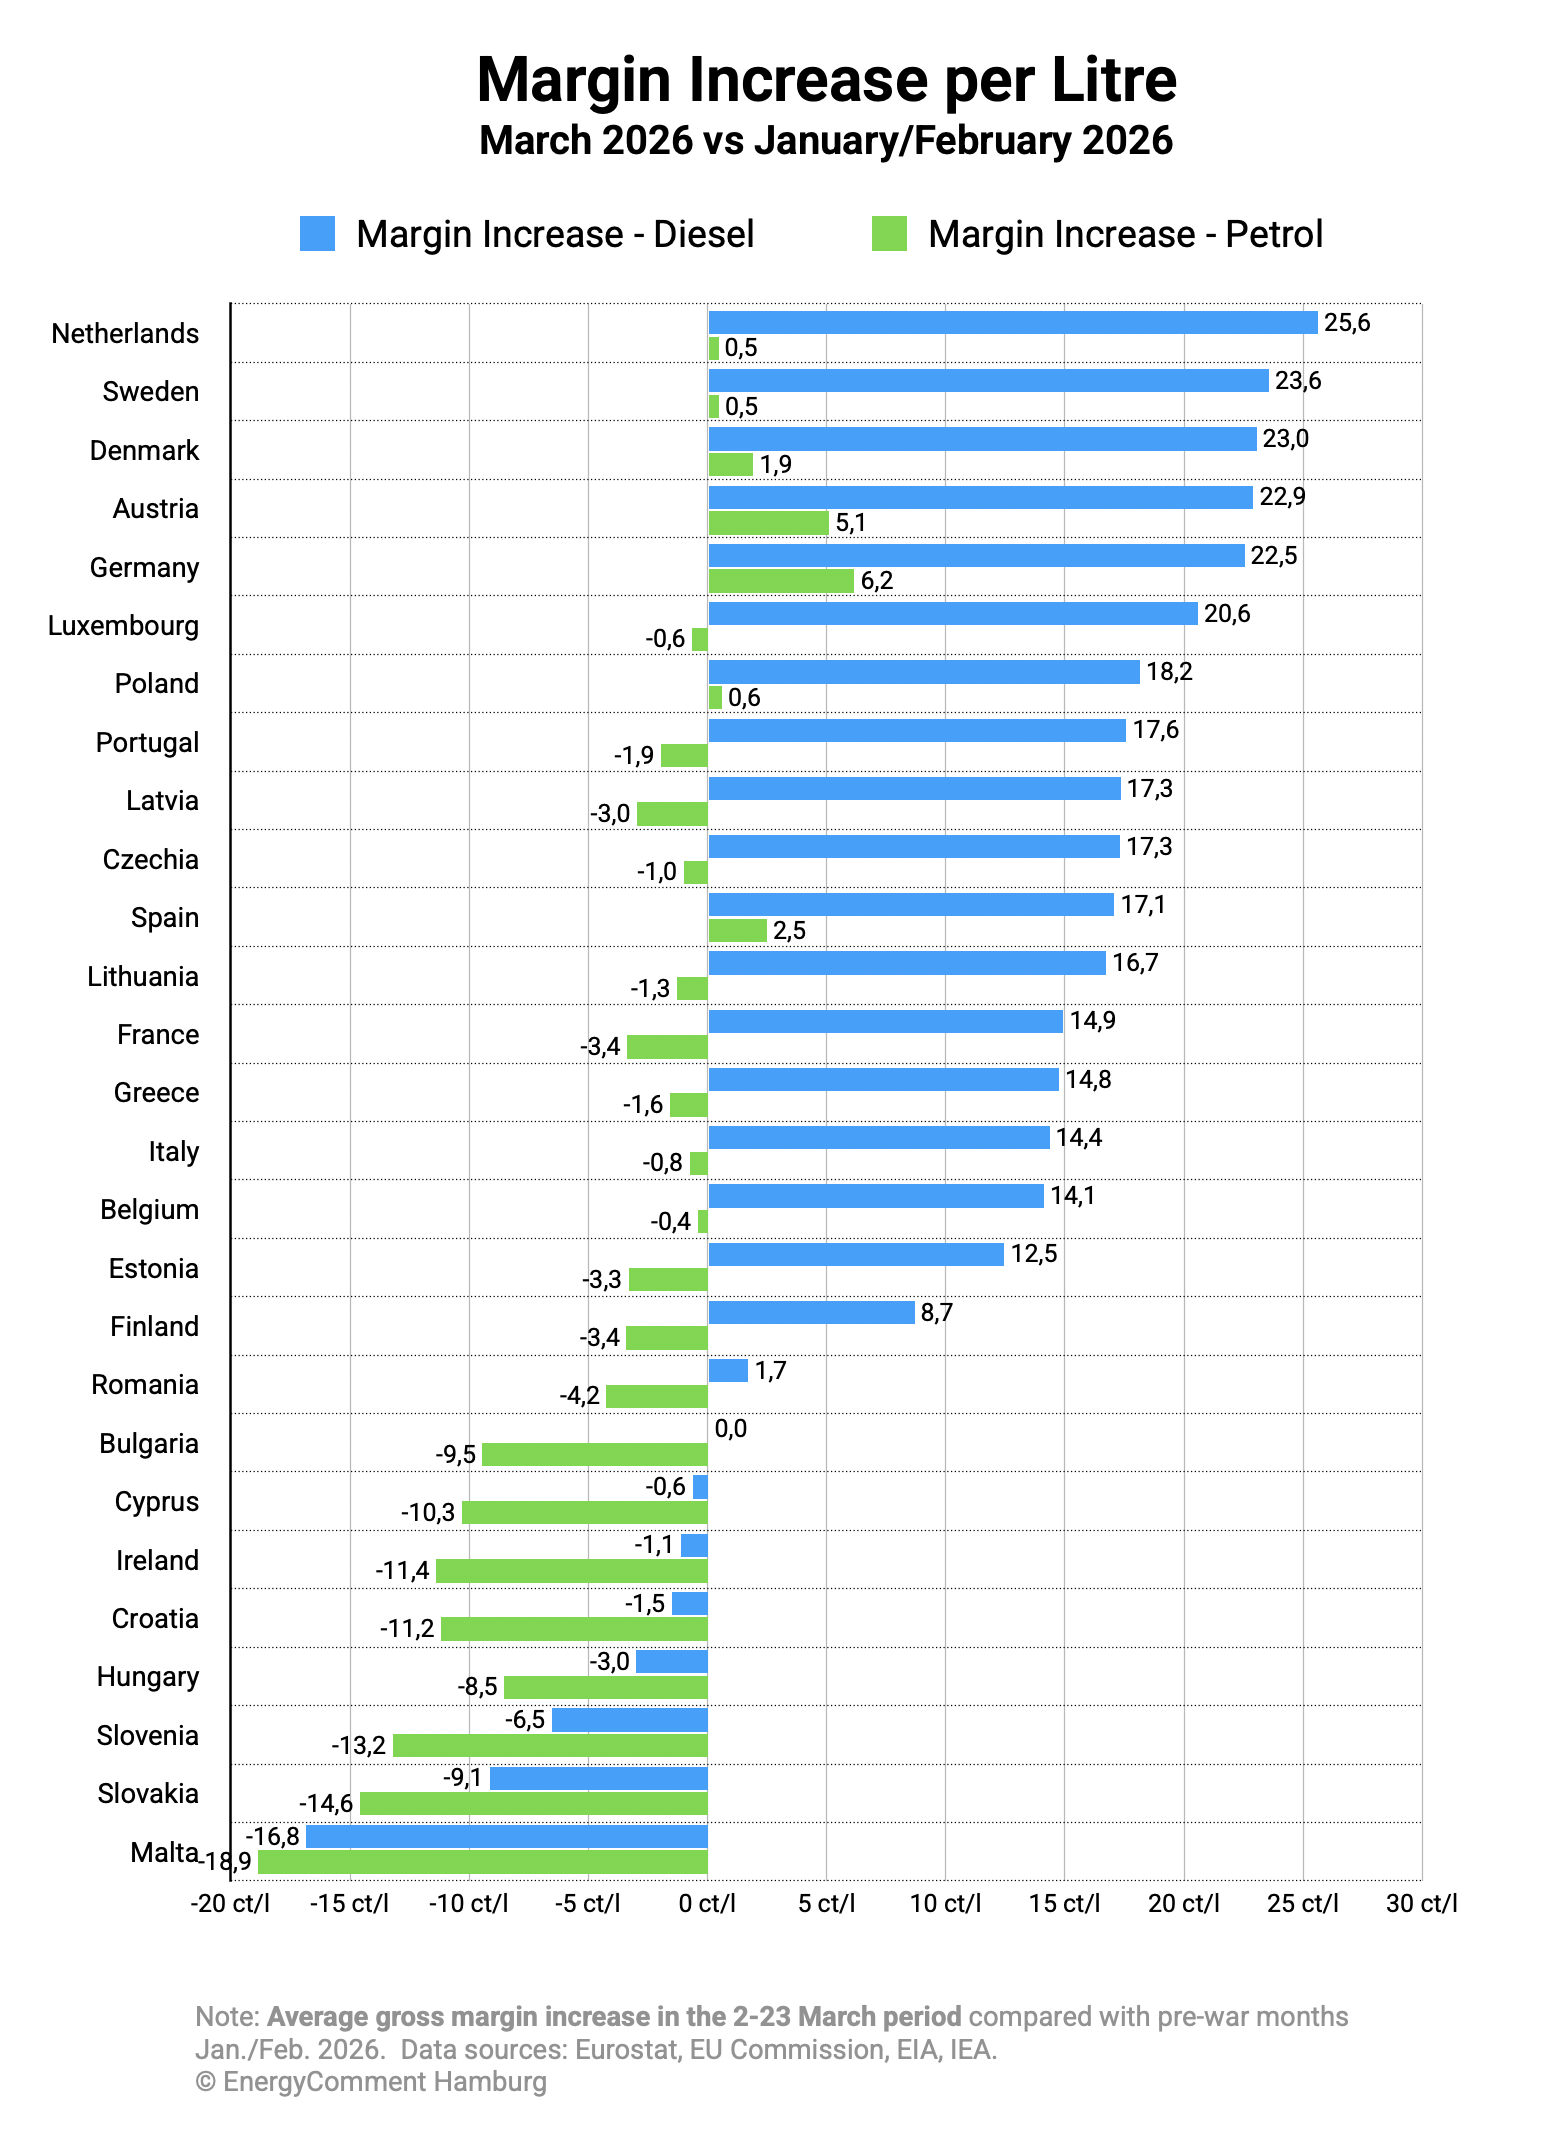
The chart (next page) shows how margins (not price levels!) in the petrol station market have developed across the 27 EU Member States.
Again, these are daily averages for the first three weeks of the war compared with the pre-war months of January/February 2026. The figures show the change in (euro) cents per litre. It bears repeating that these are merely an initial snapshot; more robust conclusions will only be possible in several weeks’ time.
The range between countries is, as expected, very wide. The ranking resembles the trends observed in March 2022, shortly after Russia’s invasion of Ukraine.[5]
In the diesel market, the oil companies expanded their margins primarily in countries with high purchasing power, where the price elasticity of demand can be expected to be lowest, meaning that drivers change their behaviour only modestly even when prices rise.
The Netherlands, Sweden, Denmark, Austria and Germany lead the field.
Conversely, margins rose comparatively little where purchasing power is lower, where government authorities intervened swiftly at petrol stations, or where competition between petrol station network operators is particularly intense.
In seven countries, the margins in the diesel market actually shrank, although all of these are comparatively small markets.
In the petrol market many refineries in the EU tend to produce a surplus of supply that then has to be exported. Here, the picture is different.
Only in Germany, Austria and Spain were the oil companies able to expand their margins significantly. In the remaining countries, margins either stayed close to the pre-war level or even declined markedly, whether due to government market interventions or high competitive pressure.
France, remains for the time being the only larger national fuel market with shrinking petrol margins.
4.3 Country Data: Total Excess Profits
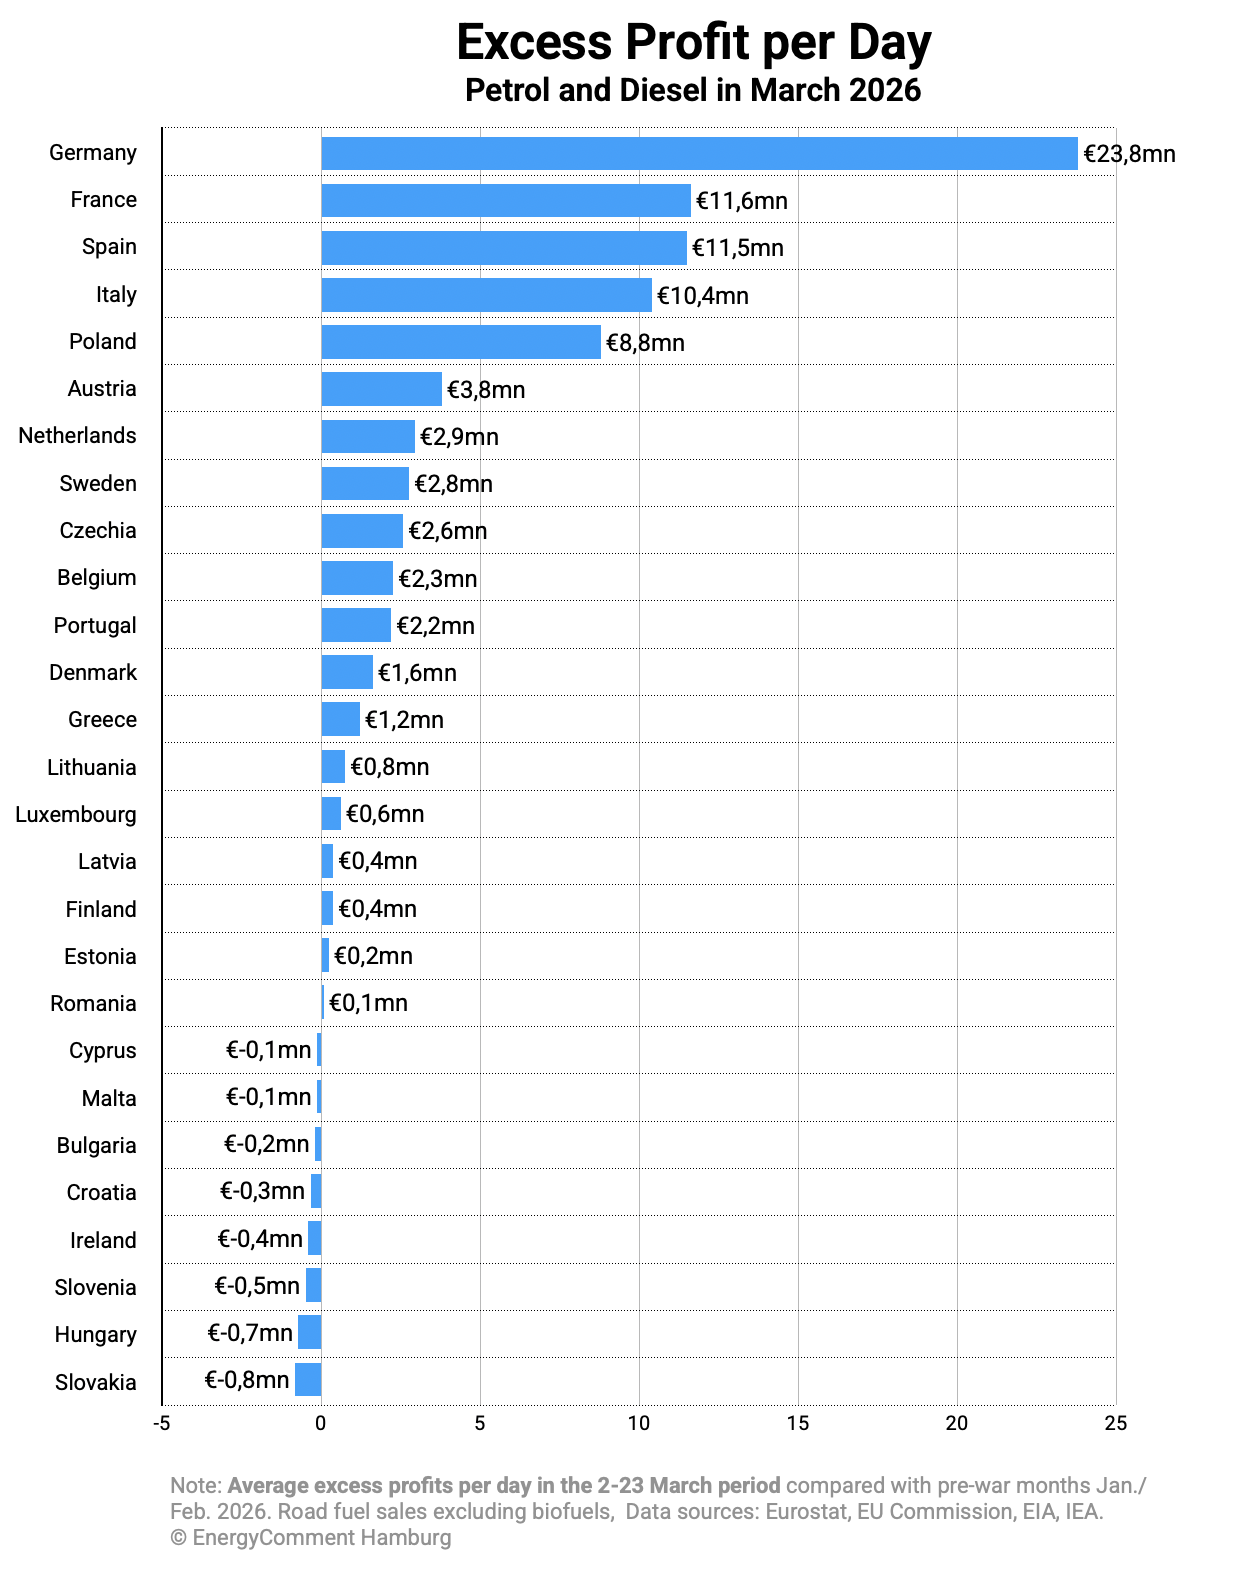
In the final step, national sales volumes of petrol and diesel are taken into account. Multiplying the per-litre additional revenue presented above by fuel sales volumes yields the total daily excess profits during the first three weeks of the war.
The chart below shows the combined total for diesel and petrol by EU Member State. As expected, German road transport stands at the top of this list. It is the largest fuel market in the EU and shows an above-average expansion of margins in March for both diesel and petrol. The excess profits of €23.8 million per day account for almost 30 per cent of EU-wide excess profits (€81.4 million, see above).
The remaining excess profits were financed primarily by road transport in the large fuel markets of France, Spain, Italy and Poland. In 14 EU Member States, daily excess profits remained below €1 million per day or were even negative.
5. Data Sources and Methodology
Crude oil prices
Brent Spot is used as a proxy for crude oil prices. The deviation from the more accessible ICE Brent Futures (front month) is small (c. 0.4 $/b), since we are working here only with average prices for January/February and March respectively.
We assume that crude oil is processed at the refinery without significant delay. We use average prices for the preceding seven days (i.e. the last five trading days, since no meaningful crude prices are determined at weekends).
We additionally take into account the mass loss incurred during the refinery process and the density differences between petrol and diesel.
Petrol station prices
As a source for petrol station prices we use the EU Oil Bulletin, which collects and publishes petrol station prices across all EU Member States on a weekly basis.[6] The methodologies used by the Member States for collecting petrol station prices are not entirely homogeneous, so slight deviations from other statistics are unavoidable. We compare the increase in petrol station prices after deducting taxes and duties.
Biofuels
For petrol station prices, we assume that the prices of blended biofuels have risen as steeply as fossil oil prices. Initial data suggest that the price increase for bioethanol and biodiesel has actually been somewhat weaker than in the fossil oil market. This implies that the margins of the oil companies may in fact be somewhat higher than calculated here.[7]
As for the national fuel consumption, we have deducted the biofuel share in order to show only the excess profits arising from the sale of fossil oil.
Fuel volumes
We use Eurostat data on road fuel consumption excluding biofuels. The most recent figures cover consumption in 2024.
We do not assume that fuel consumption volumes have changed materially in the interim. In March 2022, too, following a comparably steep price increase shortly after the outbreak of the Ukraine war, fuel volumes for both diesel and petrol remained at similar levels compared to the same month in the previous year. Current IEA data show that consumption in the major EU Member States differed only marginally from 2024 to December 2025.[8]
Gross margins and excess profits
Our approach captures the higher gross margins earned by the oil companies in the petrol station market. The correlation with operating profits is very high, since refinery costs changed only slightly and distribution costs remained largely unchanged during the period under review.
In parallel with oil prices, natural gas prices in the EU have also risen. The chart shows the development of spot prices in Western Europe from October 2021 to 28 March 2026. The current price trend is visible at the far right of the chart.
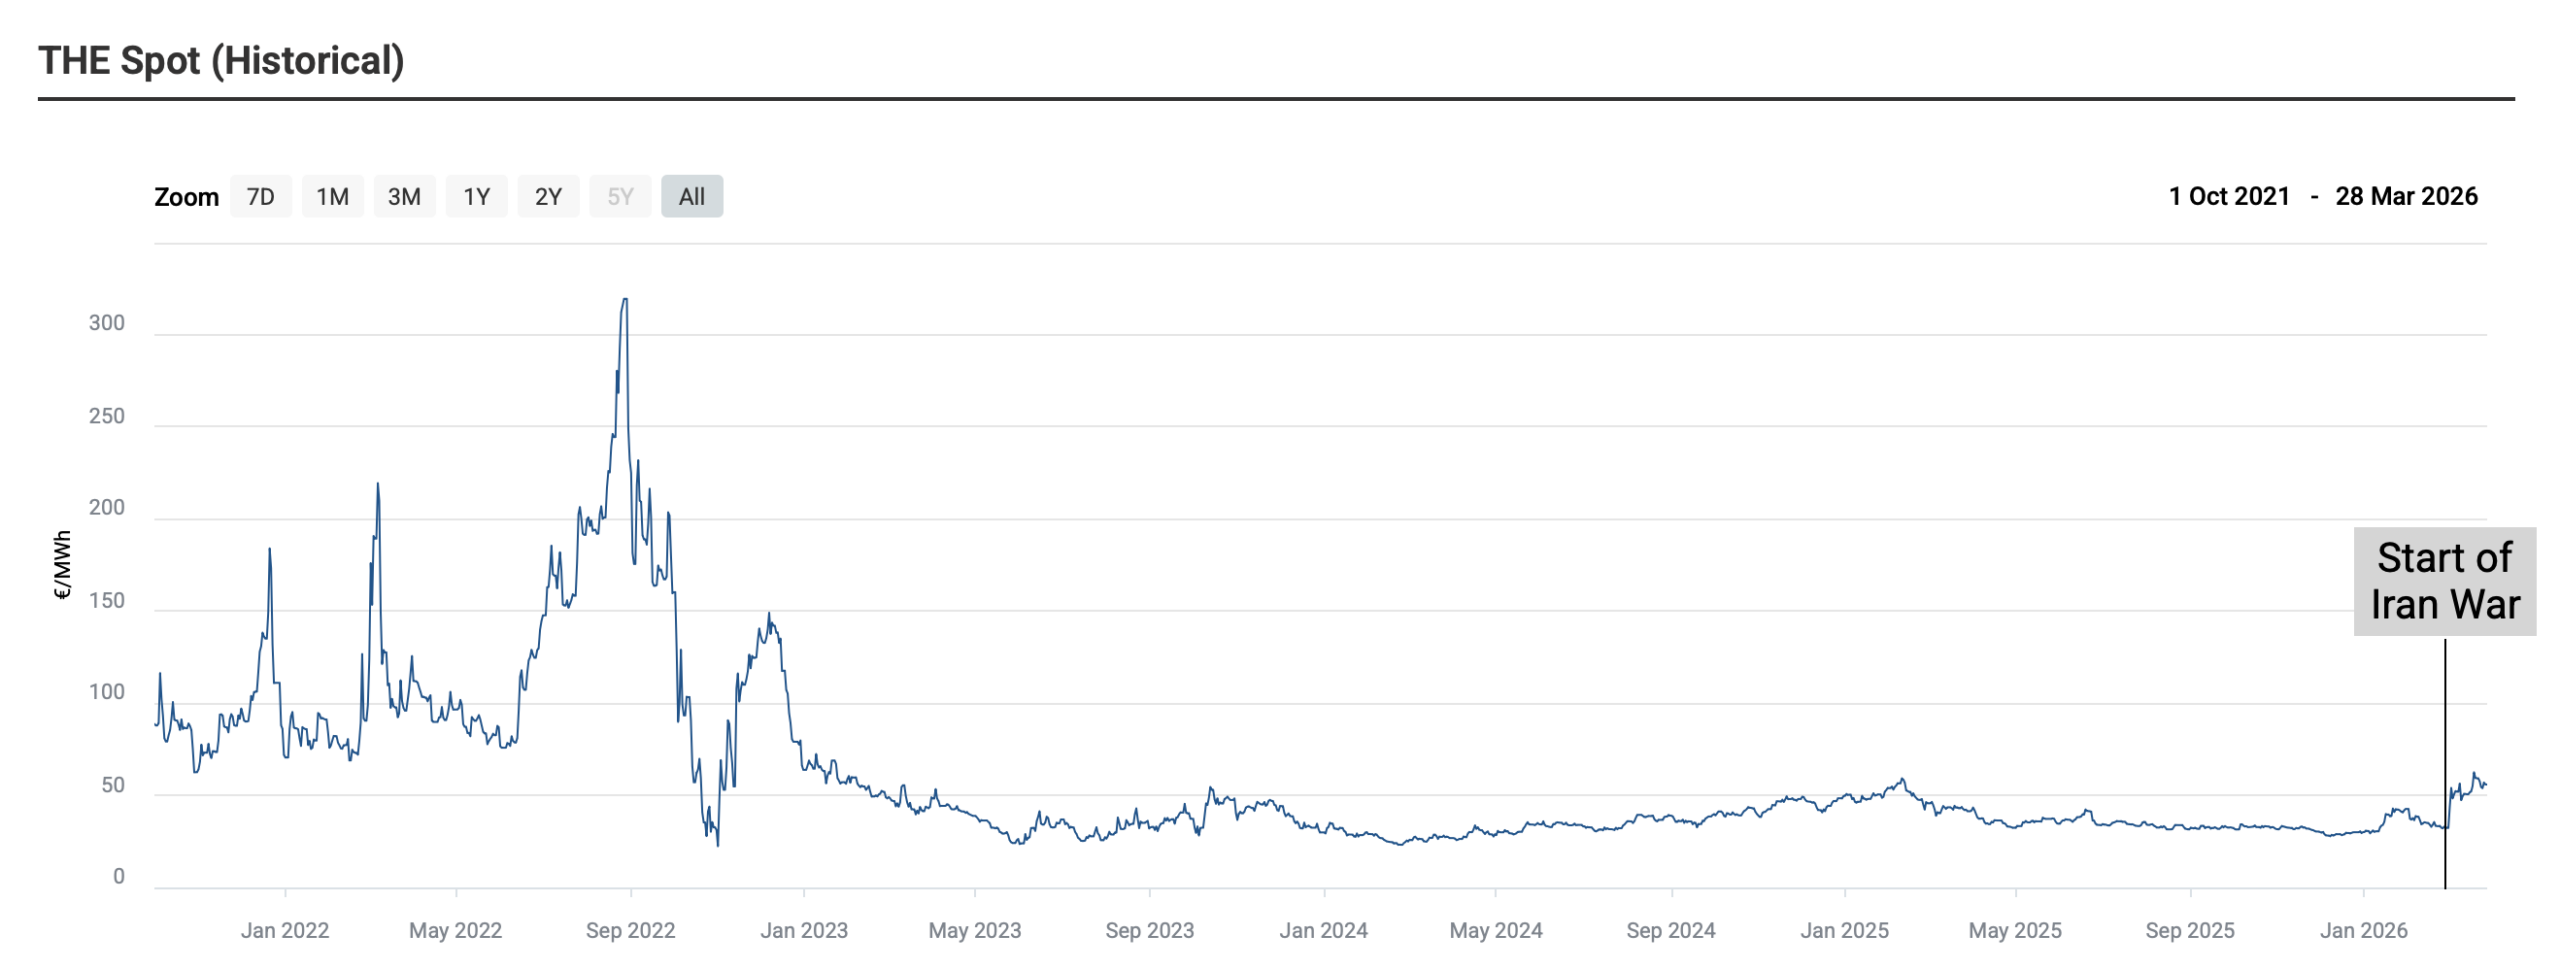
Source: SEFE (gas price chart; „Iran War“ marker by author)
Refineries have substantial gas requirements, particularly for process energy and for hydrogen production. The gas volumes needed for these purposes are predominantly generated internally as a by-product of the refining process (refinery fuel gas, RFG). Externally purchased natural gas volumes represent, on average, only a small fraction of total refinery costs, although this varies considerably from plant to plant.[9]
Higher gas prices can be mitigated by using other gases or residues from refinery operations for energy, steam generation or as feedstock for hydrogen production. These substitution strategies were deployed in 2022 in an environment of extremely high gas prices.[10] The current gas price level in the EU is well below those levels (see chart above).
We therefore assume that there is a very high correlation between the higher gross margins in the petrol station business and higher operating profits due to largely unchanged costs.
In a broader context, it should also be noted that all oil majors are active on a large scale in the international natural gas business as well. Higher natural gas prices therefore translate into higher company profits.
Front page image: Shutterstock Licence 2137626581
Quellen
https://www.iea.org/news/new-iea-report-highlights-options-to-ease-oil-price-pressures-on-consumers-in-response-to-middle-east-supply-disruptions ↑
- S.Bukold: The Dirty Dozen. The Climate Greenwashing of 12 European Oil Companies, Hamburg/Vienna 2023, S.8. ↑
- S. Bukold: Oil Profits in Times of War. An EU-wide analysis of higher margins on the sale of diesel and petrol since the beginning of the Ukraine war, Hamburg/Vienna 2022. Steep margin increases in Germany, Austria and the Netherlands in March 2022, similar to March 2026. ↑
- IEA: Oil Market Report March 2026, Paris 2026. ↑
See Footnote 3. ↑
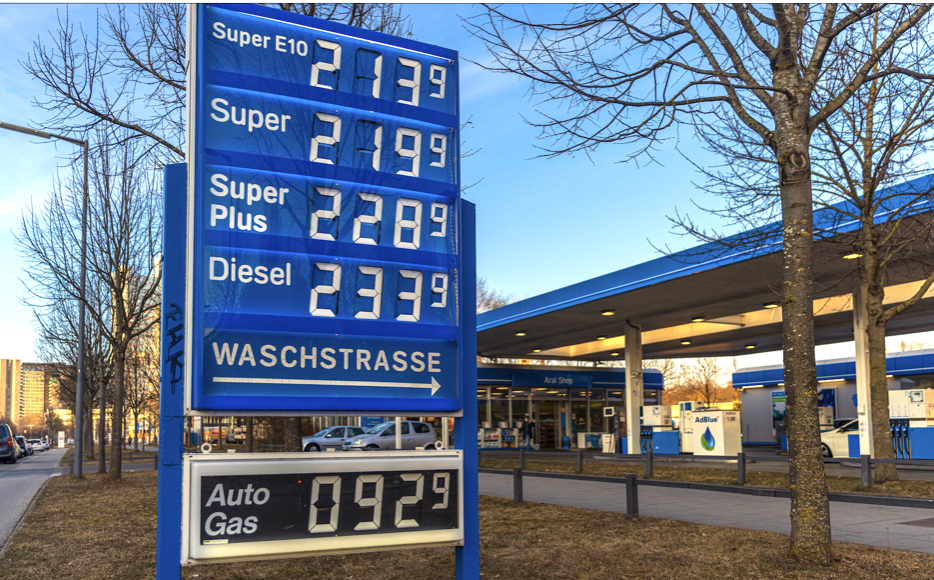
https://energy.ec.europa.eu/data-and-analysis/weekly-oil-bulletin_en; see also the front page image of this analysis. ↑
Argus: Biodiesel premiums sink but EU cap curbs demand, 9 March 2026; S&P Global Energy: European biodiesel premiums fall to 2-year lows on gasoil rally, 4 March 2026; Argus: European ethanol prices up on indirect war effects, 16 March 2026. ↑
IEA: Oil Market Report March 2026, Paris 2026. ↑
- Concawe: EU refinery energy systems and efficiency, Brussels 2012; P. Barthe, M. Chaugny, S. Roudier, L. Delgado Sancho: Best Available Techniques (BAT), Reference Document for the Refining of Mineral Oil and Gas, EU JRC, Brussels/Seville 2015. ↑
- S&P Global: European refineries, power, heating plants eyeing distillates, heavy fuels as alternative to gas: traders, 17 October 2022. ↑