Questions and data source
- How successful have electric vehicles been in global road transport to date? In a series of three short articles, we provide an overview of the segments:
- E-cars
- E-trucks
- E-vans
- E-buses
- 2/3-E-Wheelers (mopeds, motorcycles, rickshaws, etc.). More on this segment in Part 3 of our series.
- We look at the situation from three perspectives:
- Part 1: The number of new EVs sold (sales)
- Part 2: THIS POST: The share of total new sales in each segment (market/sales share)
- Part 3: The share of today’s EV fleet in the total existing fleet in each vehicle segment (stock share)
- The data is based on the IEA database (version May 2025) with figures for the whole of 2024.
Key figures and summary chart
- Absolute sales figures (see Part 1) are difficult to interpret if their relevance for the overall vehicle market remains unclear. This second part of our short series therefore focuses on the share of electric vehicles (EVs) in new sales in each segment, i.e. the sales or market share in 2024.
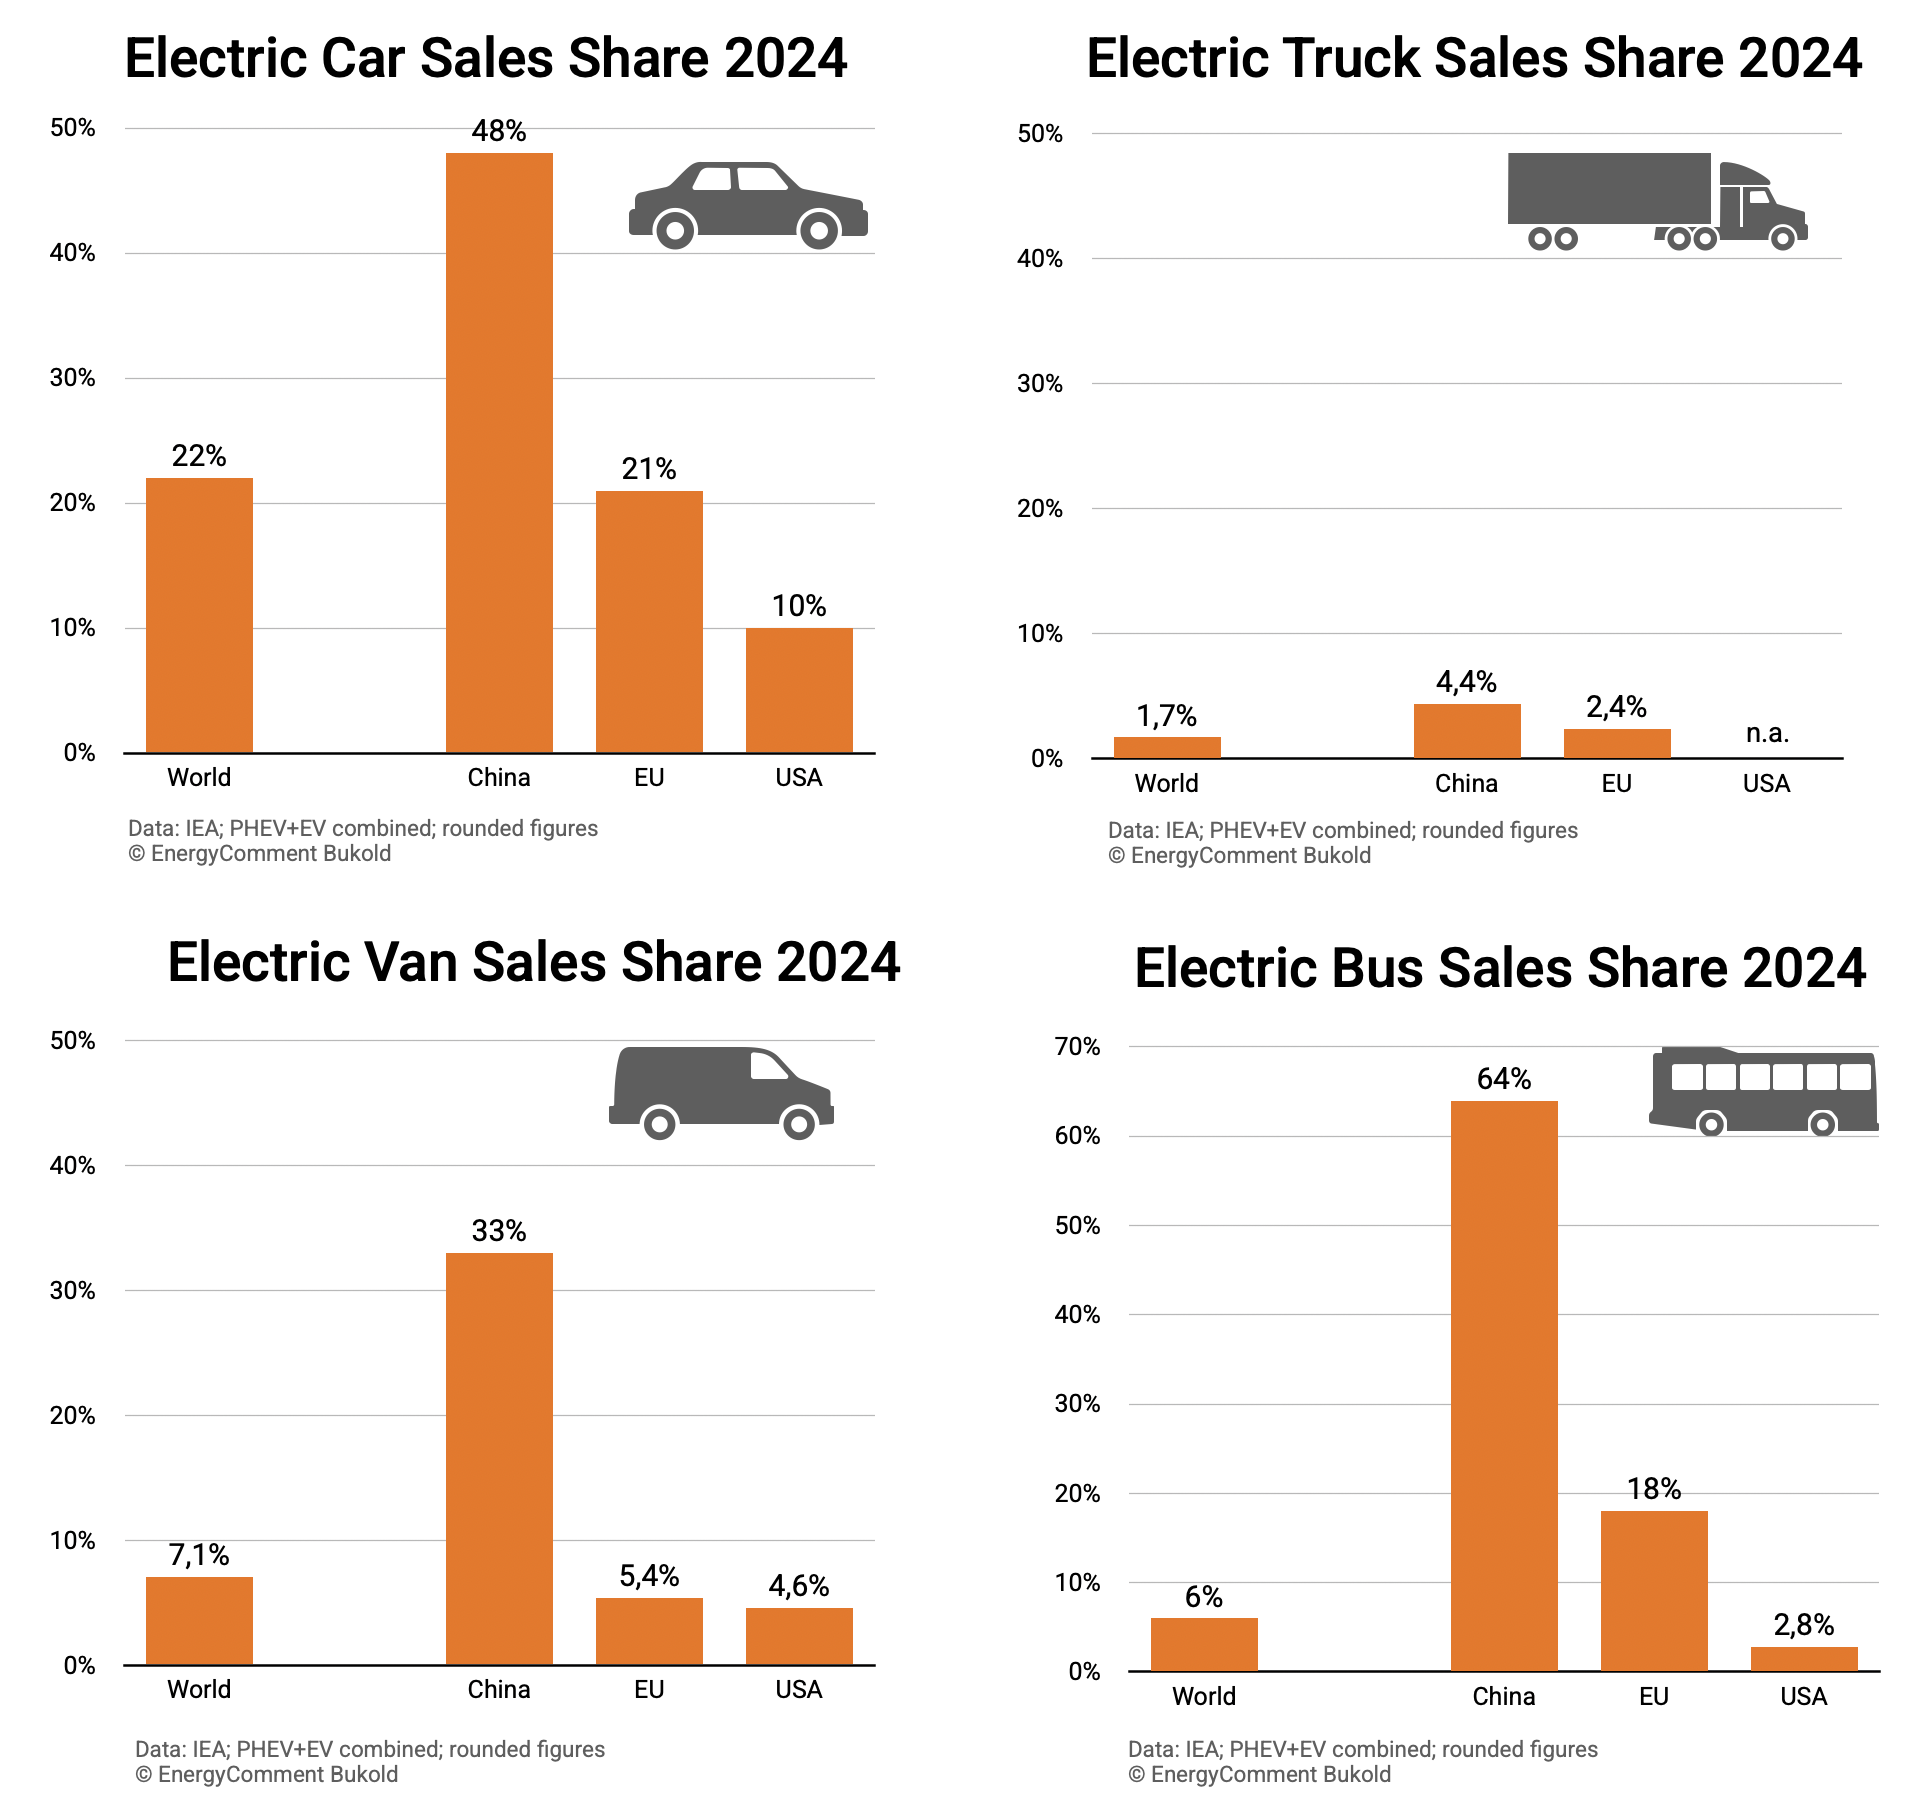
- We use the same Y-axis for alle vehicle segment (market share from 0-50%) in the following chart to highlight the large differences in market penetration.
- Electric cars: Worldwide, 22% of cars sold were electric, i.e. pure battery electric cars (BEV) or plug-in hybrid cars (PHEV). As expected, China is above this figure at 48%. This means that almost every second car in China was an electric car. At 21%, the EU is roughly in line with the global average. The USA ranks far below this with a market share of only 10%.
- Electric trucks (>3.5t): The market is still in its infancy here. The first competitive models are only coming onto the market in recent years. Market shares are therefore low so far, especially for large and heavy trucks.
- Only 1.7% of new truck sales worldwide are electric. China is not far above that at 4.4%. In the EU, the figure is 2.4%. There is no publicly available data for the USA – an anachronism in a country that can provide highly differentiated data on a weekly basis for other products such as oil and gas.
- In the case of trucks (as with vans, buses or 2/3-wheelers), it is not worth differentiating between BEV and PHEV. Almost all of the vehicles are BEVs.
- Electric vans (<3.5t): The situation for vans looks somewhat better worldwide. Last year, 7.1% of vehicles in this segment were electric. Their technical similarity to electric cars is promoting their spread. China leads the way with a market share of 33% of all new vans sold in China. In the EU and the USA, the figure is around 5%.
- Electric buses: China can look back on a long history of market development for electric buses. In some regions, the absolute numbers are even declining, as electrification is almost completed. The nationwide market share of electric buses of 64% demonstrates this success. The EU (18%) is also developing rapidly, with only the US seeing slow progress so far.
Sources
- IEA (2025), Global Electric Vehicle Outlook 2025, Paris
- IEA Database: www.iea.org/reports/global-ev-outlook-2025 (version May 2025)
- Image: Shutterstock License 2163128141
Your Comment
- Please use our contact form
Antworte auf den Kommentar von Electric Road Vehicles: Fleet Stock Shares (Part 3) – EnergyComment Antwort abbrechen