

Questions and data source
- How successful have electric vehicles been in global road transport to date? In a series of three short articles, we provide an overview of the segments:
- E-cars
- E-trucks
- E-vans
- E-buses
- 2/3-E-Wheelers (mopeds, motorcycles, rickshaws, etc.). More on this segment in Part 3 of our series.
- We look at the situation from three perspectives:
- Part 1: The number of new EVs sold (sales) (this post)
- Part 2: The share of total new sales in each segment (sales share)
- Part 3: The share of today’s EV fleet in the total existing fleet in each vehicle segment (stock share)
- The data is based on the IEA database (version May 2025) with figures for the whole of 2024.
Key figures and summary chart
- The task for the coming decades is enormous. According to BNEF, there are 1.3 billion passenger cars, 170 million vans (LCV <3.5t), 83 million trucks and other heavy commercial vehicles (HDV >3.5t) and 3.4 million buses worldwide.
- Here are the key figures for vehicle sales (see also chart below):
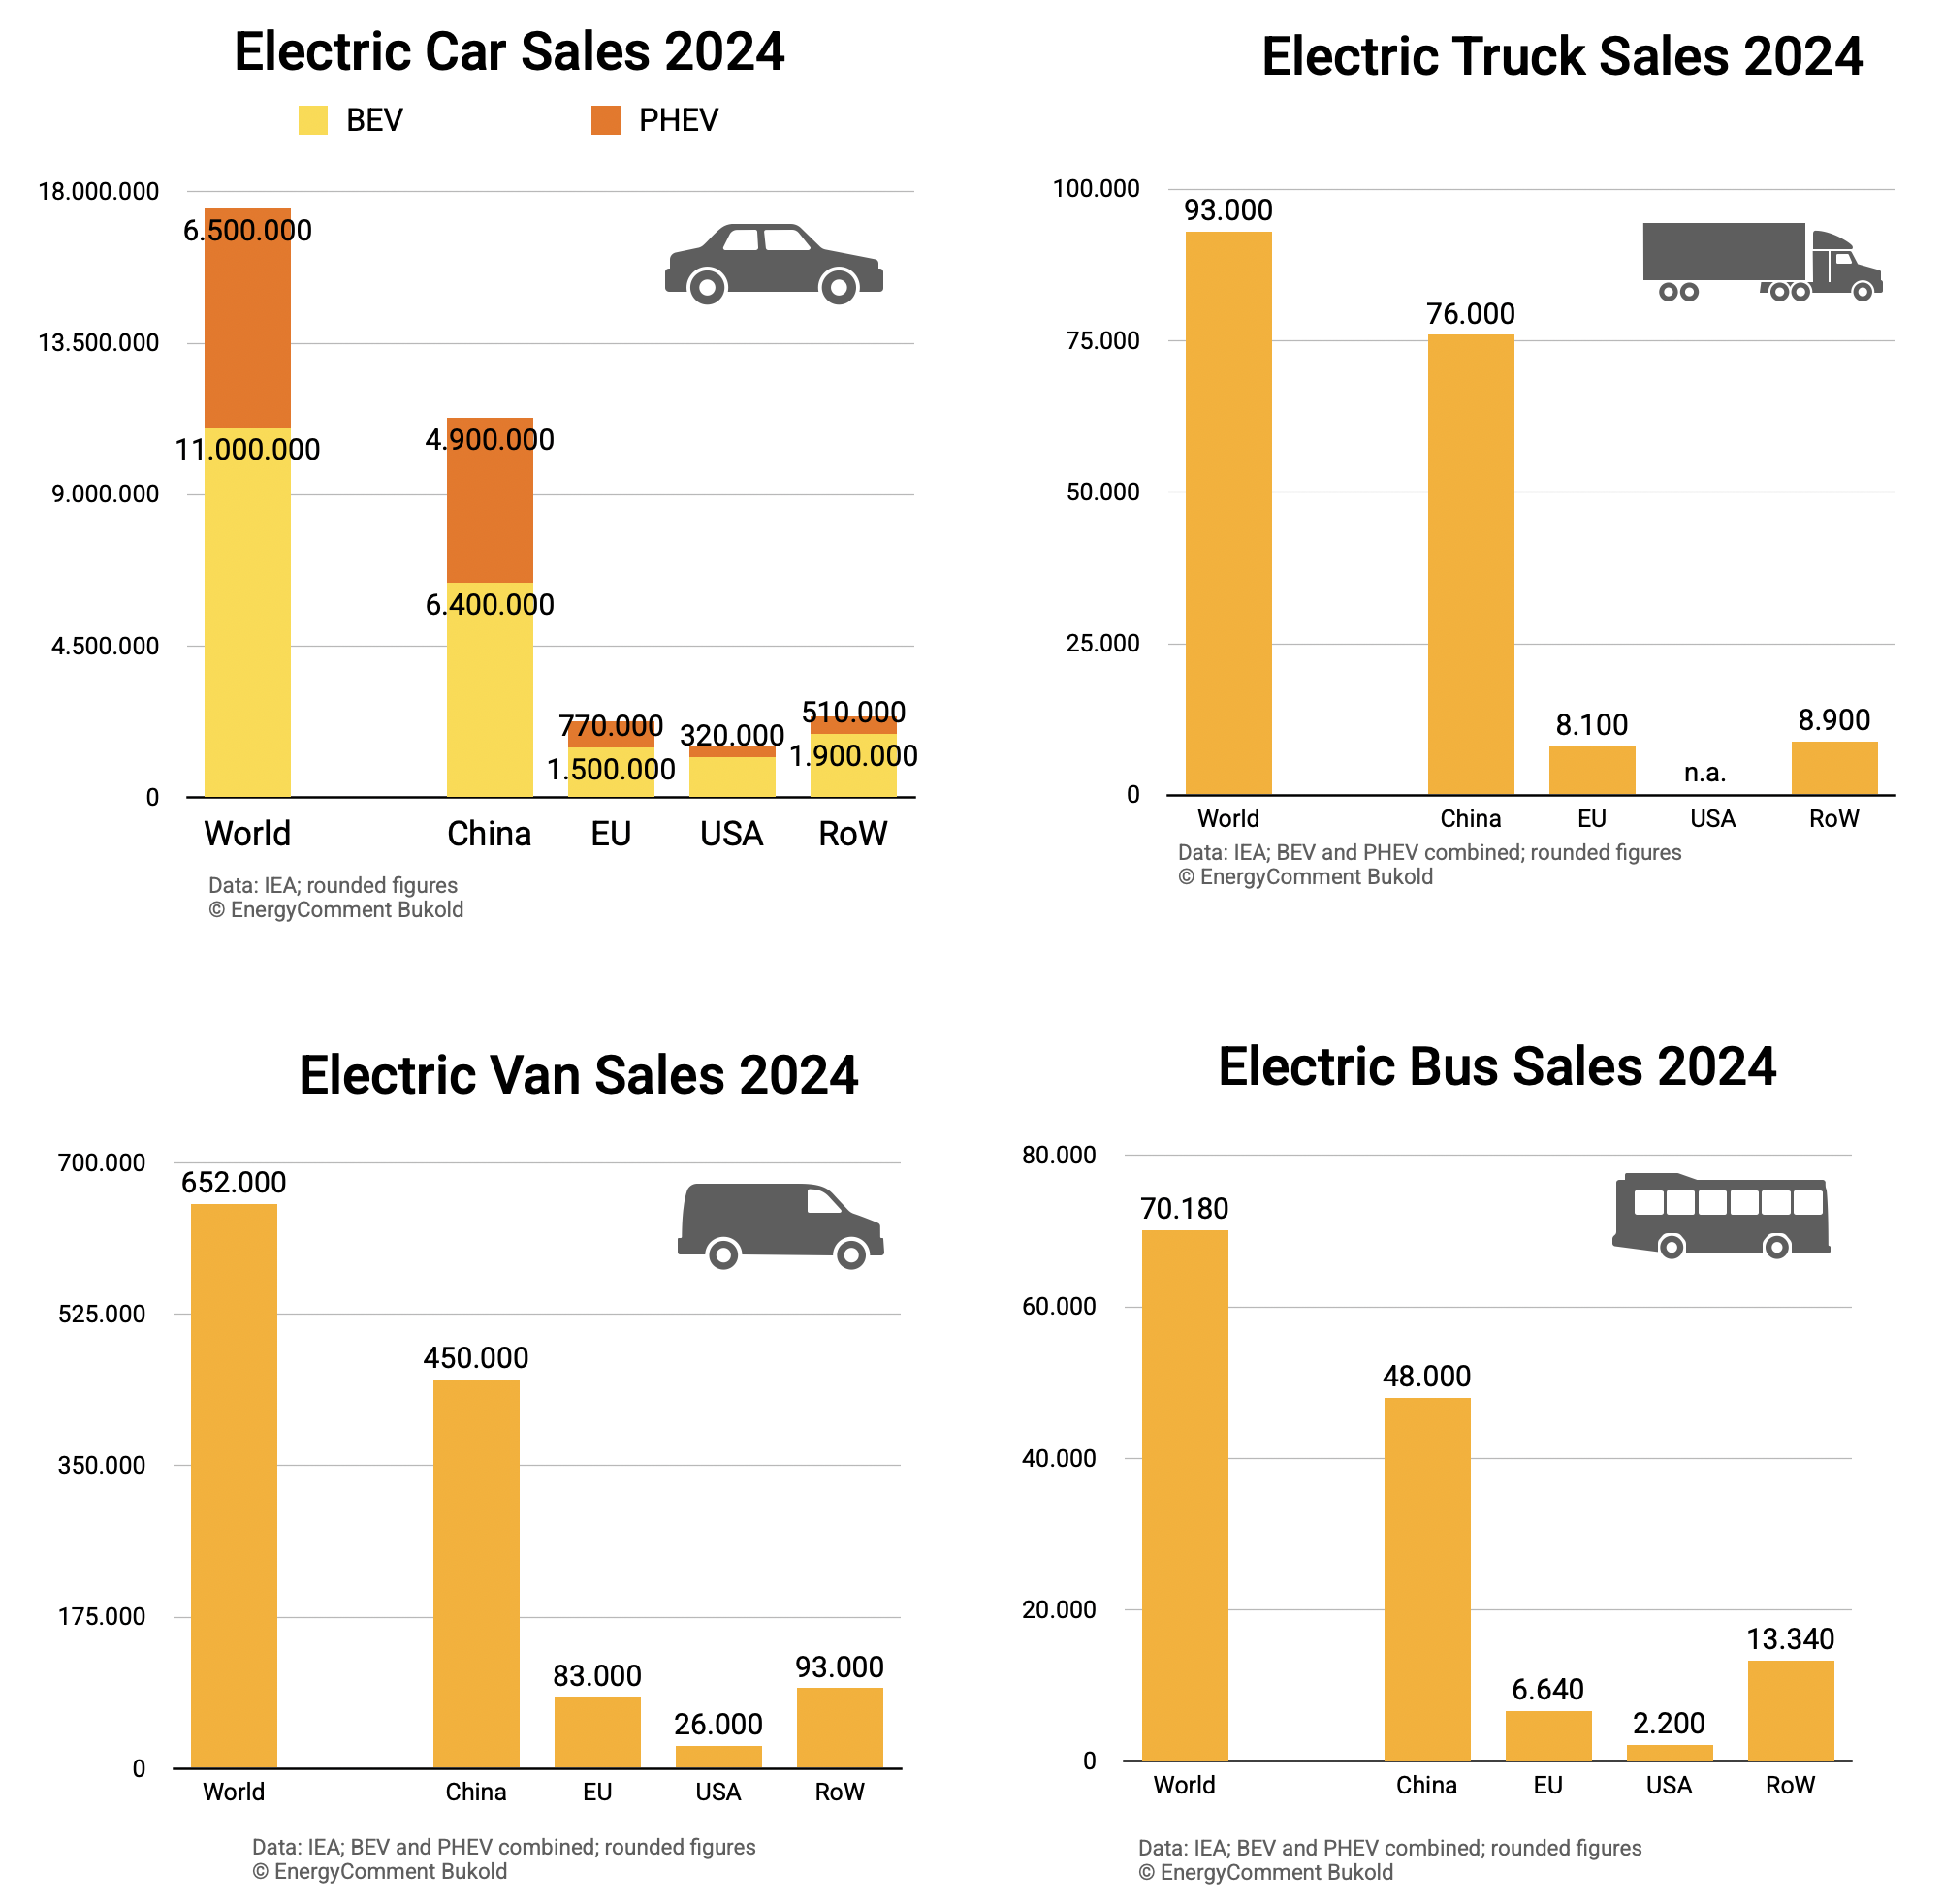
- Last year, 17.5 million electric cars were sold worldwide, of which 11 million were pure BEVs (battery-electric vehicles) and 6.5 million were PHEVs (plug-in hybrid vehicles).
- China alone accounts for 65% of new electric car sales. The EU and the USA rank far behind. Not much has happened in the rest of the world so far. Only 14% of sales take place outside the three major economic blocs.
- E-trucks (>3.5t): China accounts for just under 82% of the total 93,000 e-trucks sold last year. At least things are moving forward in the EU (unfortunately, no data is available for the USA). Less than 10% of electric trucks are sold outside the three economic blocs.
- Electric vans: China’s dominance is less pronounced in the delivery van segment (69%). Nevertheless, 83,000 electric vans were sold in the EU last year. There is also movement outside the three economic blocs.
- Electric buses: This also applies to the electric bus segment. Worldwide, 70180 new electric buses entered the market last year.
- The chart provides an overview of the figures. Please note the differences in the Y-axis! Worldwide, the number of electric cars sold is 18 times greater than the number of electric trucks sold!
Sources
- IEA (2025), Global Electric Vehicle Outlook 2025, Paris
- IEA Database: www.iea.org/reports/global-ev-outlook-2025 (version May 2025)
- Image: Shutterstock License 2163128141
Your Comment
- Please use our contact form