Questions and data source
- How successful have electric vehicles been in global road transport to date? In a series of three short articles, we provide an overview of the segments:
- E-cars
- E-trucks
- E-vans
- E-buses
- 2/3-E-Wheelers (mopeds, motorcycles, rickshaws, etc.). More on this segment in Part 3 of our series.
- We look at the situation from three perspectives:
- Part 1: The number of new EVs sold (sales)
- Part 2: The share of total new sales in each segment (market/sales share)
- Part 3: THIS POST: The share of today’s EV fleet in the total existing fleet in each vehicle segment (stock share/fleet share) and a look at the segment of 2/3-Wheelers.
- The data is based on the IEA database (version May 2025) with figures for the whole of 2024.
Key figures: Electric Fleet Shares
- In this post, we come to the third indicator for electric mobility on the roads: the electric share of existing vehicle fleets.
- This is where change is slowest, as even a high share of new sales will only noticeably electrify the existing fleet over the course of many years. If the share is already low in the new vehicle market, the existing fleet will remain dominated by ICE vehicles for the foreseeable future.
- This perspective is crucial in terms of climate policy, because what good is a ramp-up in electric mobility if countless vehicles with internal combustion engines (diesel, petrol, natural gas) are still on the road at the same time?
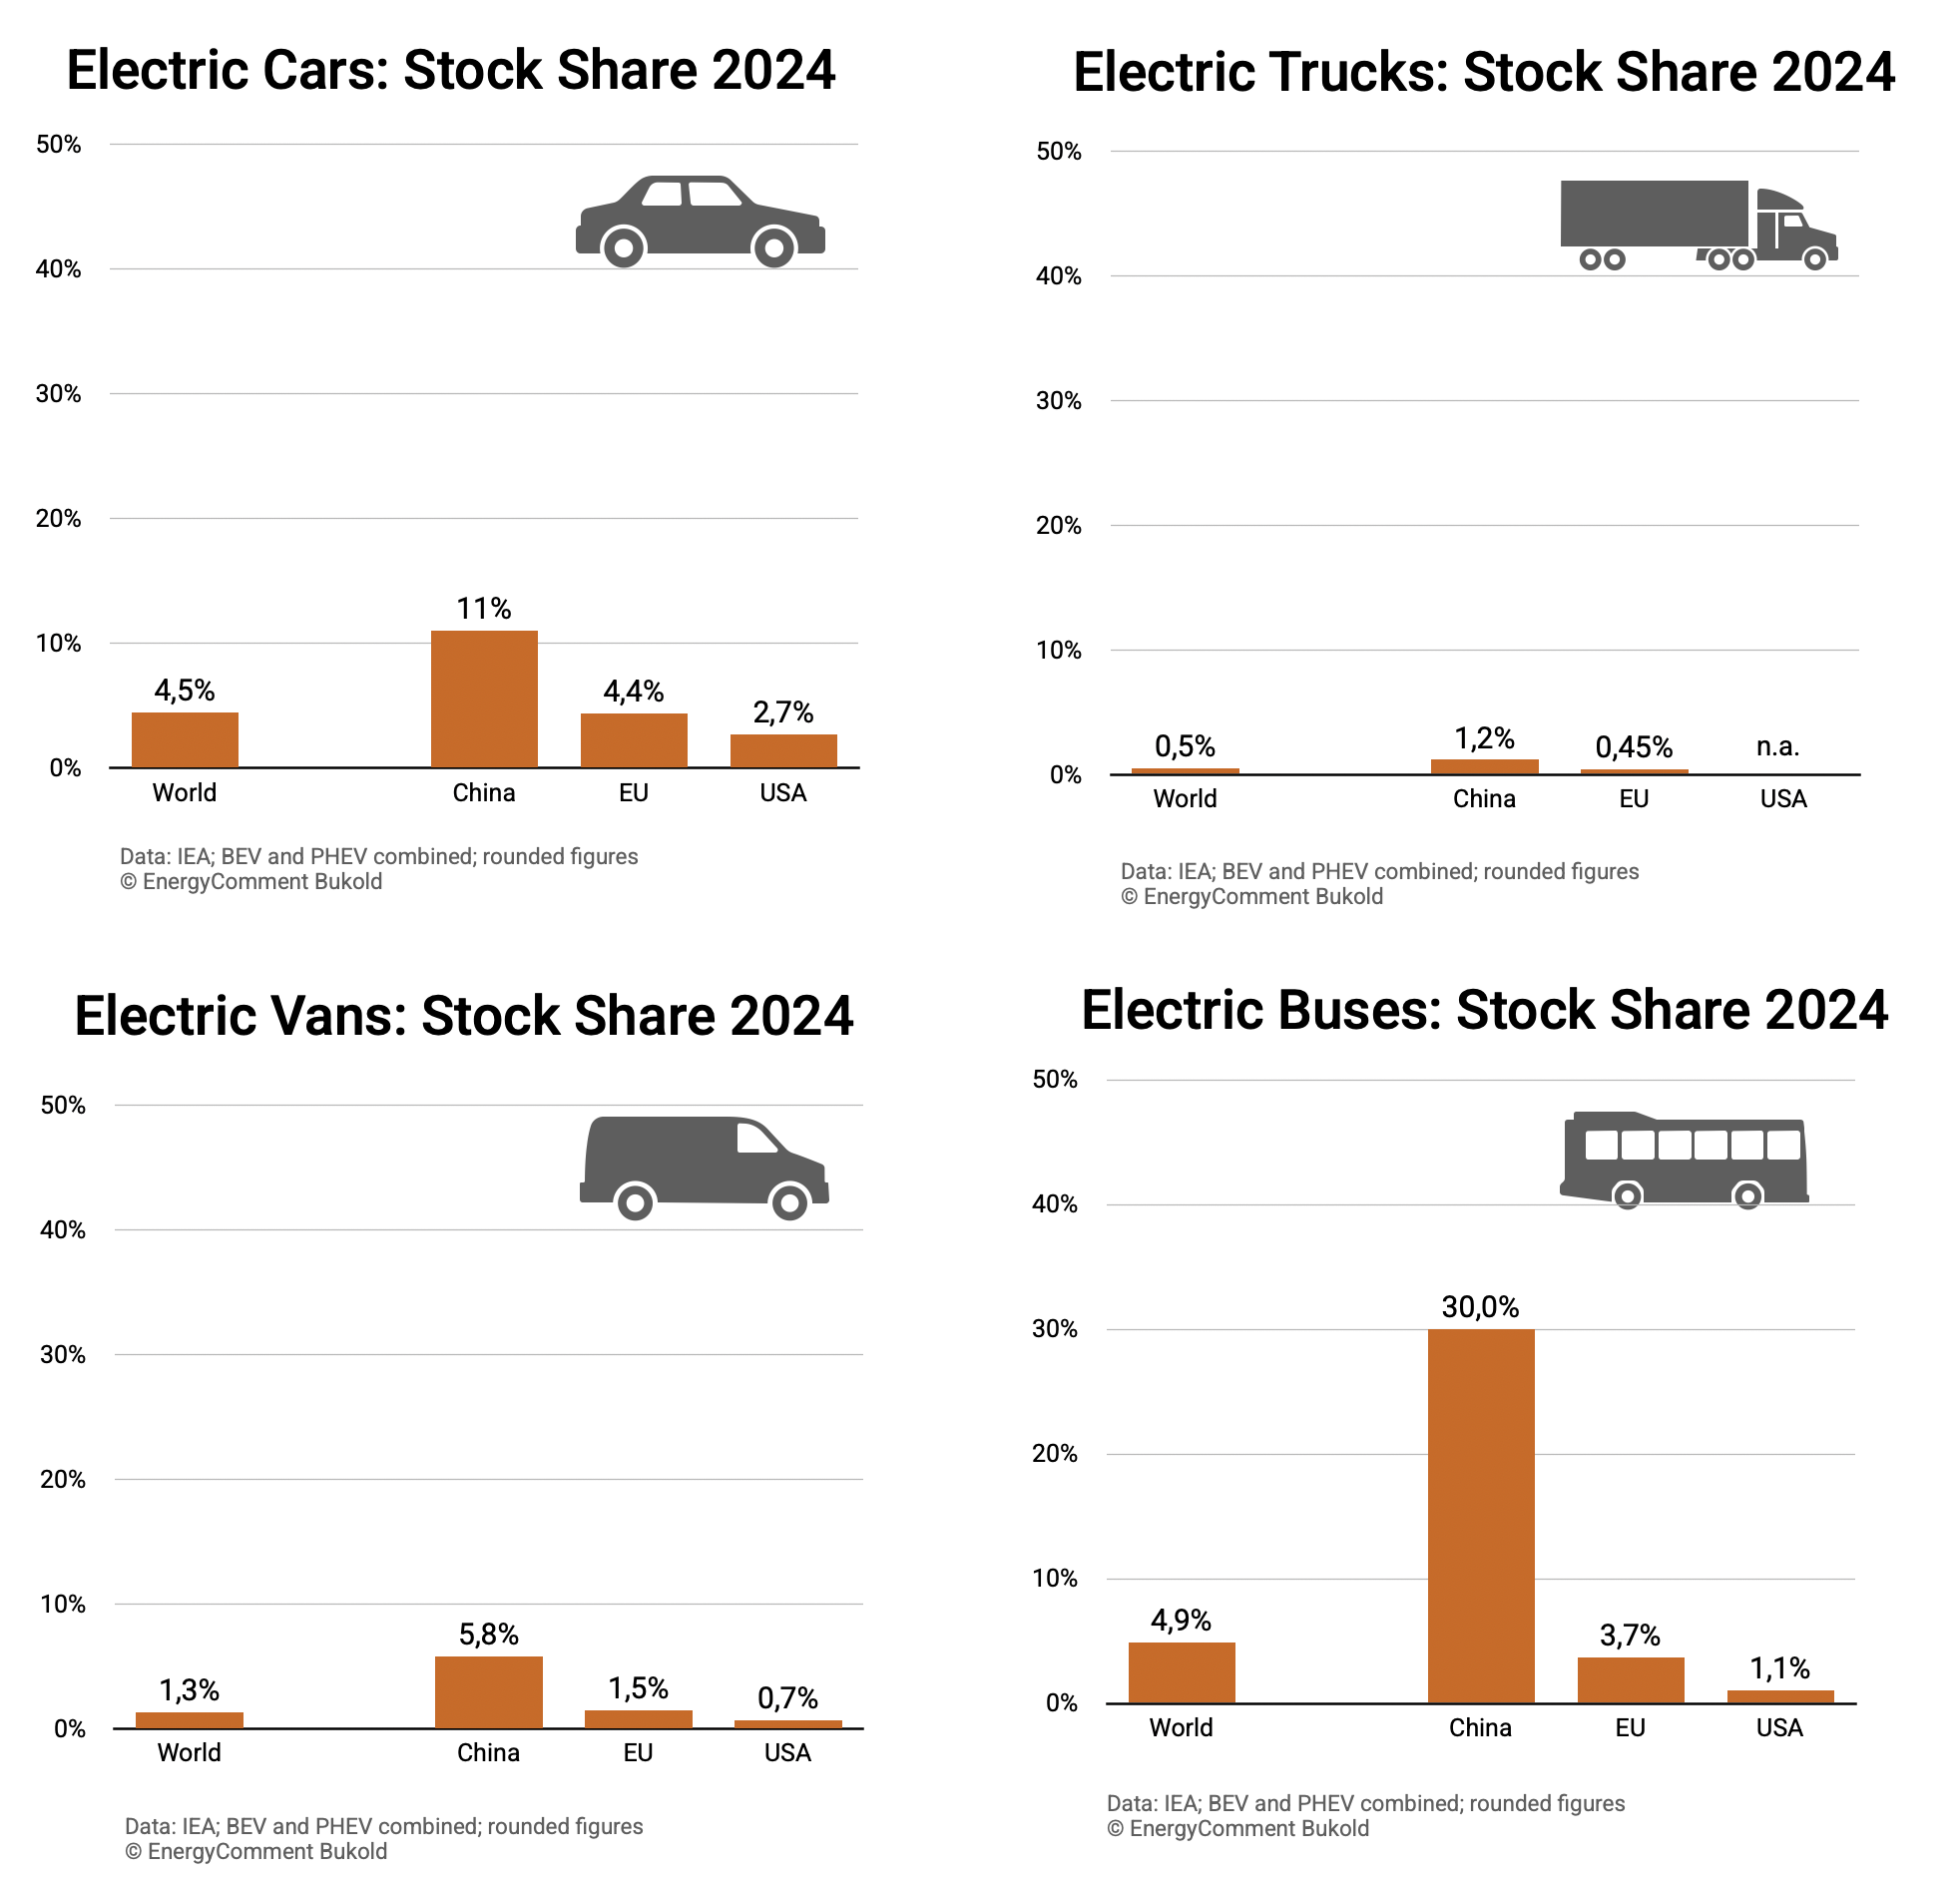
- Here, too, we always use the same Y-axis, which can show fleet shares from 0-50%.
- Even more than the absolute sales figures or market shares in the new vehicle sector, the charts below show how far we still have to go to electrify road transport. A look at the charts is sobering:
- Electric cars: So far, only 4.5% of the car fleet is electric. Even in China, the figure is only 11%. With a fleet share of 4.4%, the EU is roughly in line with the global average.
- Electric trucks: In this segment, only 0.5% of the fleet has been electrified so far. Even in China, the figure is a meagre 1.2%.
- Electric vans: The situation is not much better here. The share of electric vans in existing fleets worldwide is 1.3%. In China, the figure is 5.8%, and in the EU 1.5%.
- Electric buses: The situation is better in the bus segment. Government and municipal clients and the problems of urban air pollution caused by diesel buses are pushing the share of electric buses in the fleet to 4.9%. In China, the figure is already 30%, with many wealthy provinces on the east coast far exceeding this. A stark contrast: in the USA, the figure is only 1.1% so far.
Electric 2/3-Wheelers
- Finally, a bright spot: electric 2/3-wheelers
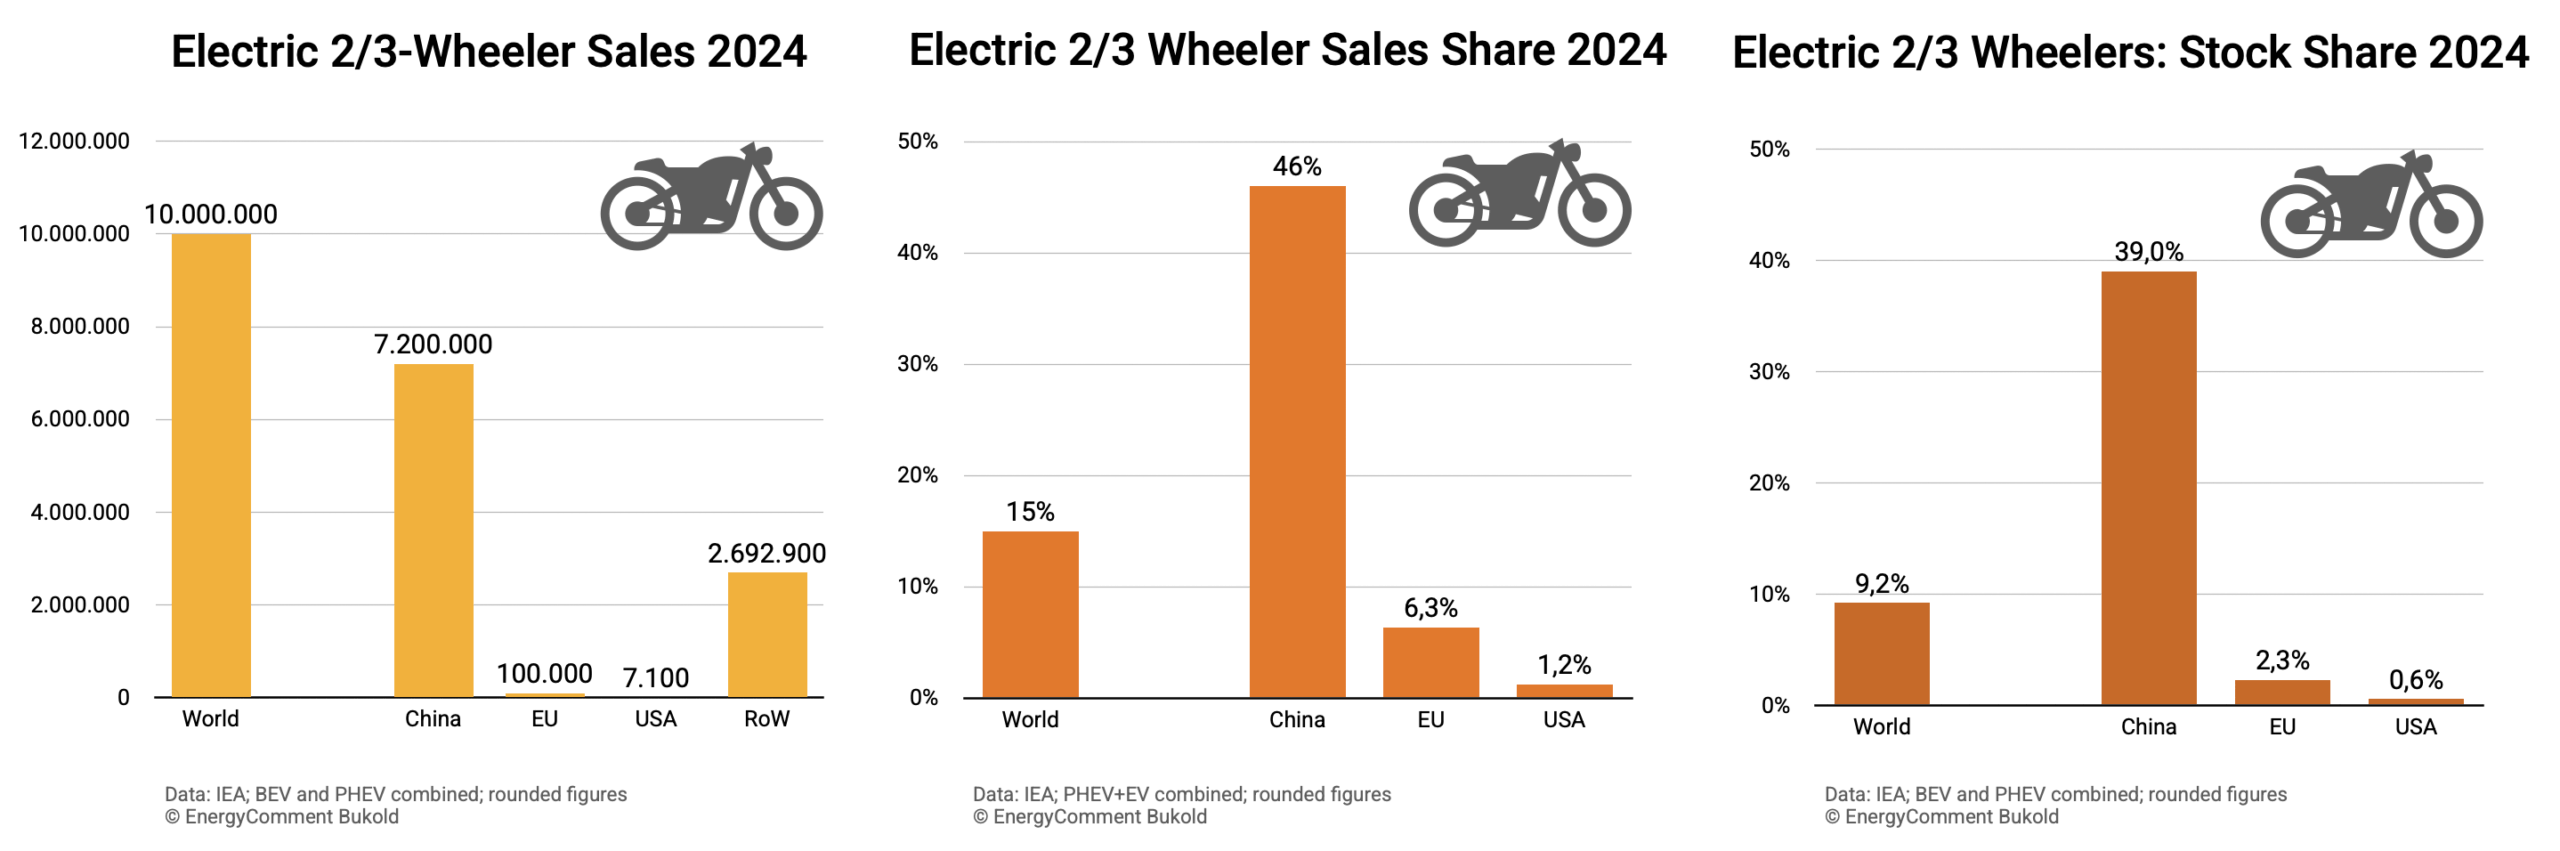
- To conclude our series of three posts on electric mobility, let’s take a look at a vehicle segment that is particularly relevant in China, Southeast Asia and South Asia: mopeds, motorcycles, rickshaws and similar 3-wheelers for transporting goods and people.
- We are talking about enormous vehicle numbers here. Last year, 10 million electric 2/3-wheelers were sold worldwide. China has a market share of 72% here.
- In the EU and the USA, this segment has hardly played a role so far. But in the rest of the world (especially Asia without China), almost 2.7 million of them were sold.
- In China, almost every second new 2/3-wheeler sold is electric. Worldwide, the figure is 15%.
- Electric 2/3-wheelers already account for 39% of the Chinese 2/3-wheeler fleet stock. Worldwide, they account for 9.2% of the fleet. In the EU, they have so far played only a marginal role. In the USA, they are hardly present at all.
Sources
- IEA (2025), Global Electric Vehicle Outlook 2025, Paris
- IEA Database: www.iea.org/reports/global-ev-outlook-2025 (version May 2025)
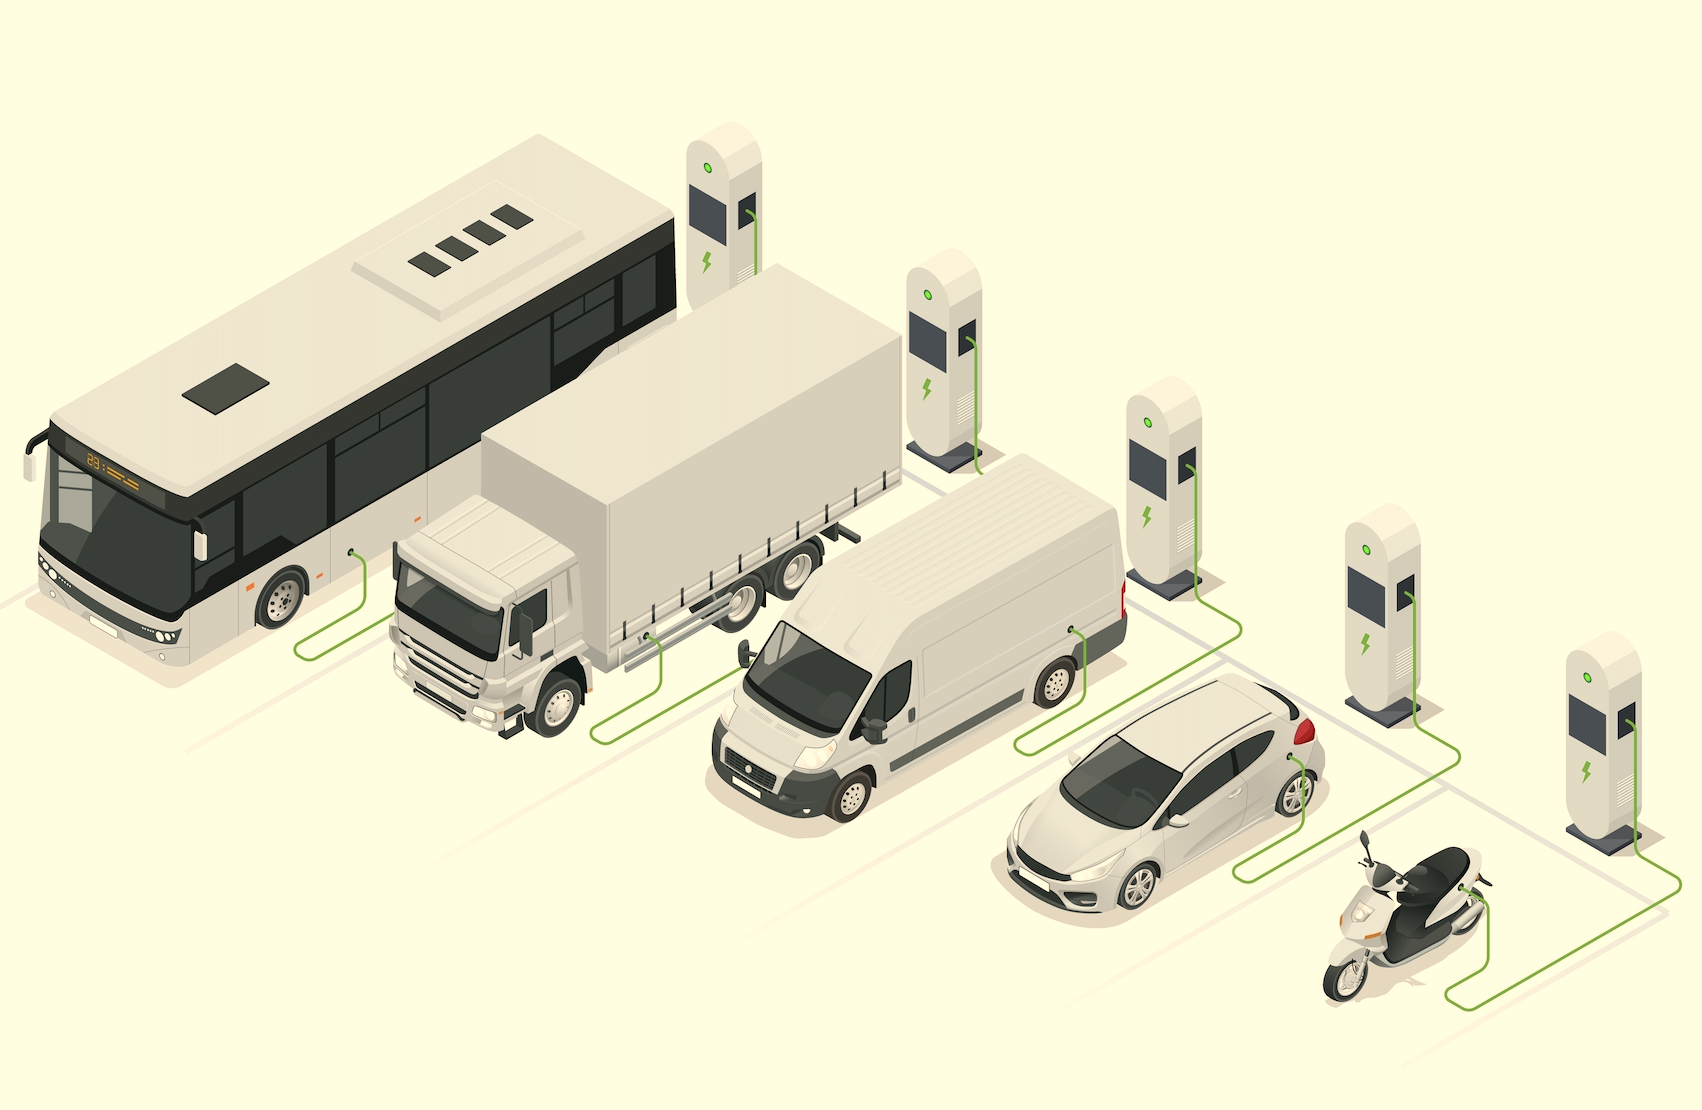
- Image: Shutterstock License 2163128141
Your Comment
- Please use our contact form
Schreibe einen Kommentar