Summary
- LNG tankers are responsible for 10% of emissions from international maritime shipping (65 Mt CO2e).
- The entire LNG supply chain, from wellhead to combustion, increases natural gas emissions by about one-third (19g CO2e/MJ). Approximately 20% of this (3.5g CO2e/MJ) is attributable to emissions from LNG tankers.
- There are effective measures to significantly reduce LNG tanker emissions quickly and at manageable costs. In the long term, however, LNG from fossil natural gas is a dead end for climate policy.
Introduction: LNG, Shipping and the Climate
- LNG, i.e. cooled liquefied natural gas, has become the second most important shipping fuel in recent years. It is far ahead of biofuels, e-fuels and modern H2/battery solutions.
- Although LNG is considered an ‘alternative fuel’, this classification says nothing about its carbon footprint. Liquefied natural gas is almost exclusively fossil-based. Bio-LNG has not yet played a role in shipping.
- But what does the carbon footprint actually look like? Opinions differ widely. This applies less to the actual combustion of LNG or natural gas in the power plant or in the ship’s engine.
- What is more controversial is the level of emissions associated with the provision of LNG, i.e. from the gas well, through gas processing and the pipeline to the export terminal, the energy-intensive liquefaction process (cooling to -162℃) at the terminal, transport via LNG tankers across the oceans, regasification and finally transport via pipeline to the end consumer.
- The IEA presented an overview report on this issue in June. Data from 350 gas fields in 22 countries, 45 LNG export terminals and 220 regasification terminals from 50 countries as well as 750 LNG tankers were compiled.
Main Findings 1: Emissions of LNG Supply Chains
- On average, emissions in the LNG supply chains are 19.5g CO2e per MJ of LNG (19.5g CO2 equivalents per megajoule of LNG supplied). That is the equivalent of 70g CO2e per kWh of LNG.
- Around 70% of this is accounted for by CO2 emissions and just under 30% by methane emissions, which are converted into CO2 equivalents here.
- The amount of 19.5g is not insignificant. When LNG or natural gas is burnt by the end consumer, 55g CO2/MJ (198g CO2/kWh) are released. The emissions therefore increase by an average of 35 per cent due to the complex provision of LNG.
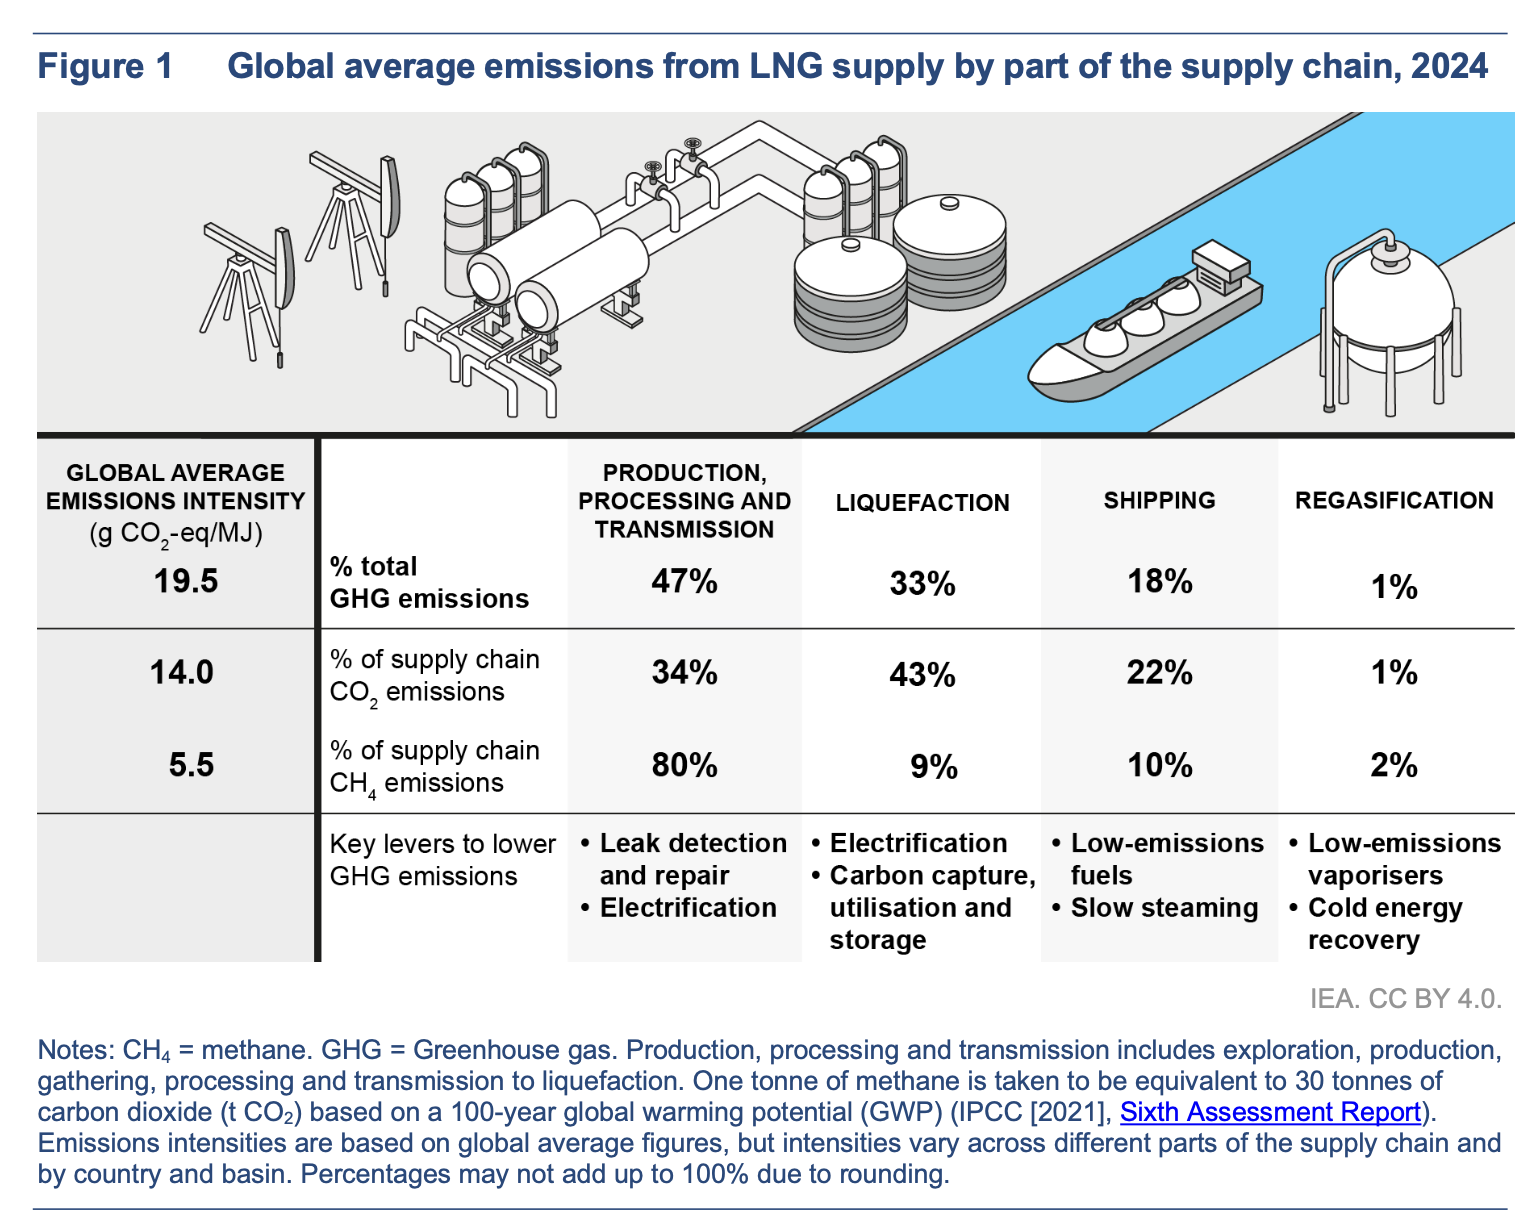
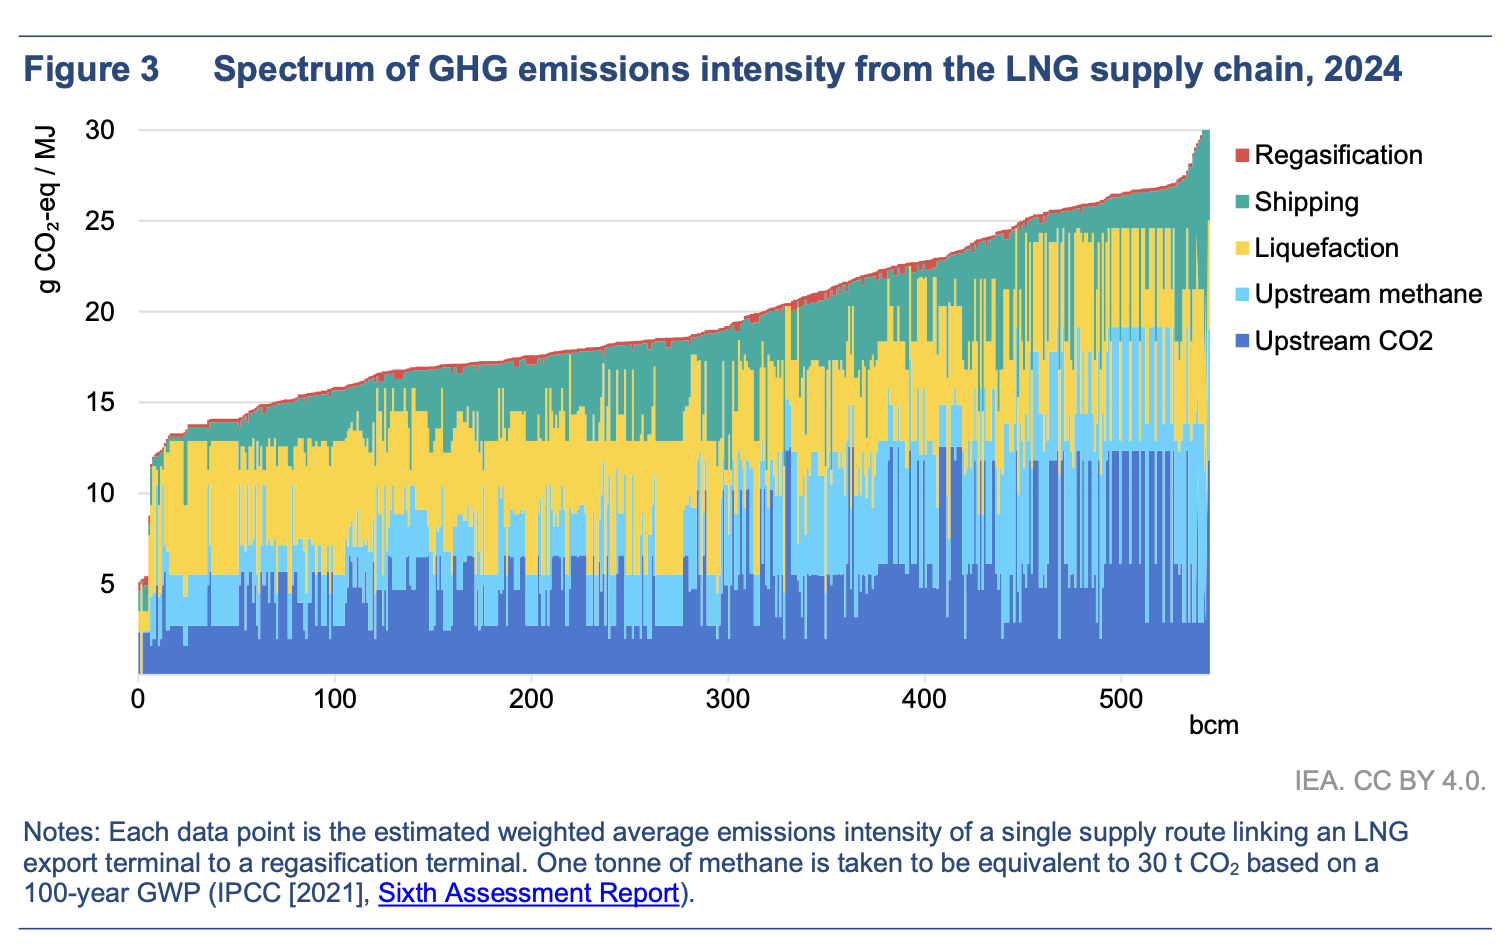
- The differences between the individual LNG supply chains are very large. It ranges from just 6g CO2e for LNG from Norway to 30g CO2e for LNG from Africa or South-East Asia. Depending on the distance travelled and drive technology, for example, the contribution of LNG tankers to overall emissions can be very low or significant (green segment in the next chart).
- Methodological differences also contribute to the varying results between studies:
- While the IEA spreads the climate damage caused by methane emissions over a period of 100 years, some authors choose a shorter period of 20 years. Depending on the period chosen, 1 tonne of methane corresponds to 30 tonnes or 82.5 tonnes of CO2.
- The selection of export terminals or the year under review is also relevant. In boom years, for example, methane emissions in the Permian Basin in the USA tend to be unusually high.
- Compared to current studies, the IEA results are in the middle of the range, but there are also studies that show twice as high emissions, mainly due to higher estimates for methane.
- The IEA assumes a global average methane emission intensity of 0.6% (i.e. the proportion of methane that escapes directly into the atmosphere along the supply chain). For supply chains from the USA to Europe, the IEA estimates the figure to be 1.4%.
Main Findings 2: LNG Carrier – Fuels, Engines and Emissions
- There are 760 LNG tankers sailing the world’s oceans. They make around 7,000 round trips each year, i.e. from the export terminals to the coasts of the importing countries and back. The average distance is 2x5000km.
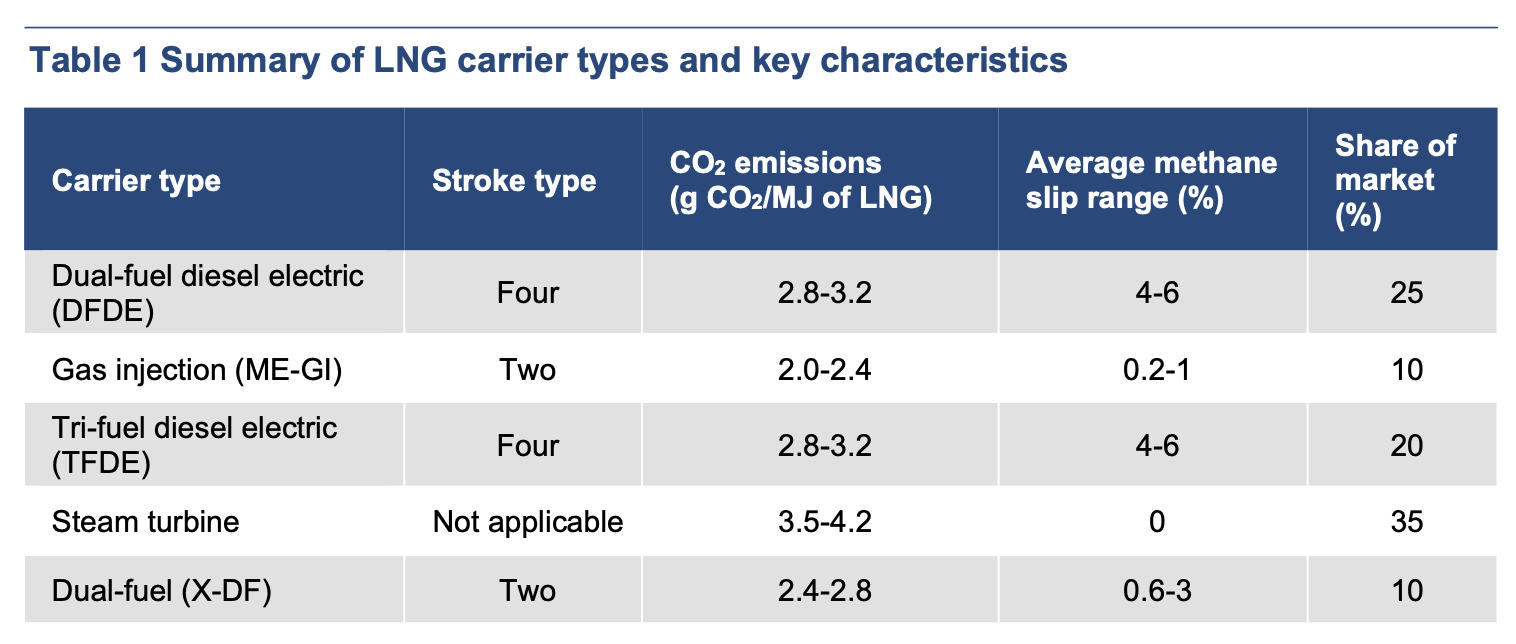
- On average, 3.5g CO2e per MJ of LNG cargo is released. There are significant differences between the types of propulsion, as the figure shows. Methane slip and fuel combustion are the most significant sources of emissions.
- The trend is towards low-consumption two-stroke engines. Steam turbines have the best methane emissions balance, but fuel consumption is very high.
- In total, LNG carriers consumed around 800 PJ of fuel in 2024, mainly boil-off gas from their own cargo, but also some heavy fuel oil or marine gas oil.
- This caused 55 Mt of CO2 emissions and a further 10 Mt of CO2e emissions from methane emissions.
- The total corresponds to approximately 10% of the total emissions from international shipping.
- Conversely, this means that switching from natural gas/LNG to locally produced renewables around the world could also significantly reduce emissions in shipping.
- However, emissions in the LNG trade could also be reduced rapidly today:
- By far the most important measure is slow steaming (i.e. a ‘speed limit’). This alone has accounted for two-thirds of the efficiency gains achieved by LNG tankers since 2008.
- Improvements to the ship’s hull, operational processes and supplementary wind assistance technologies could save a further 20 per cent of propulsion energy overall, according to IEA estimates.
Sources
- Source of all charts and title image: IEA
- Download Link: IEA: Assessing Emissions from LNG Supply and Abatement Options, Paris June 2025
Your Comment
- Please use our contact form